

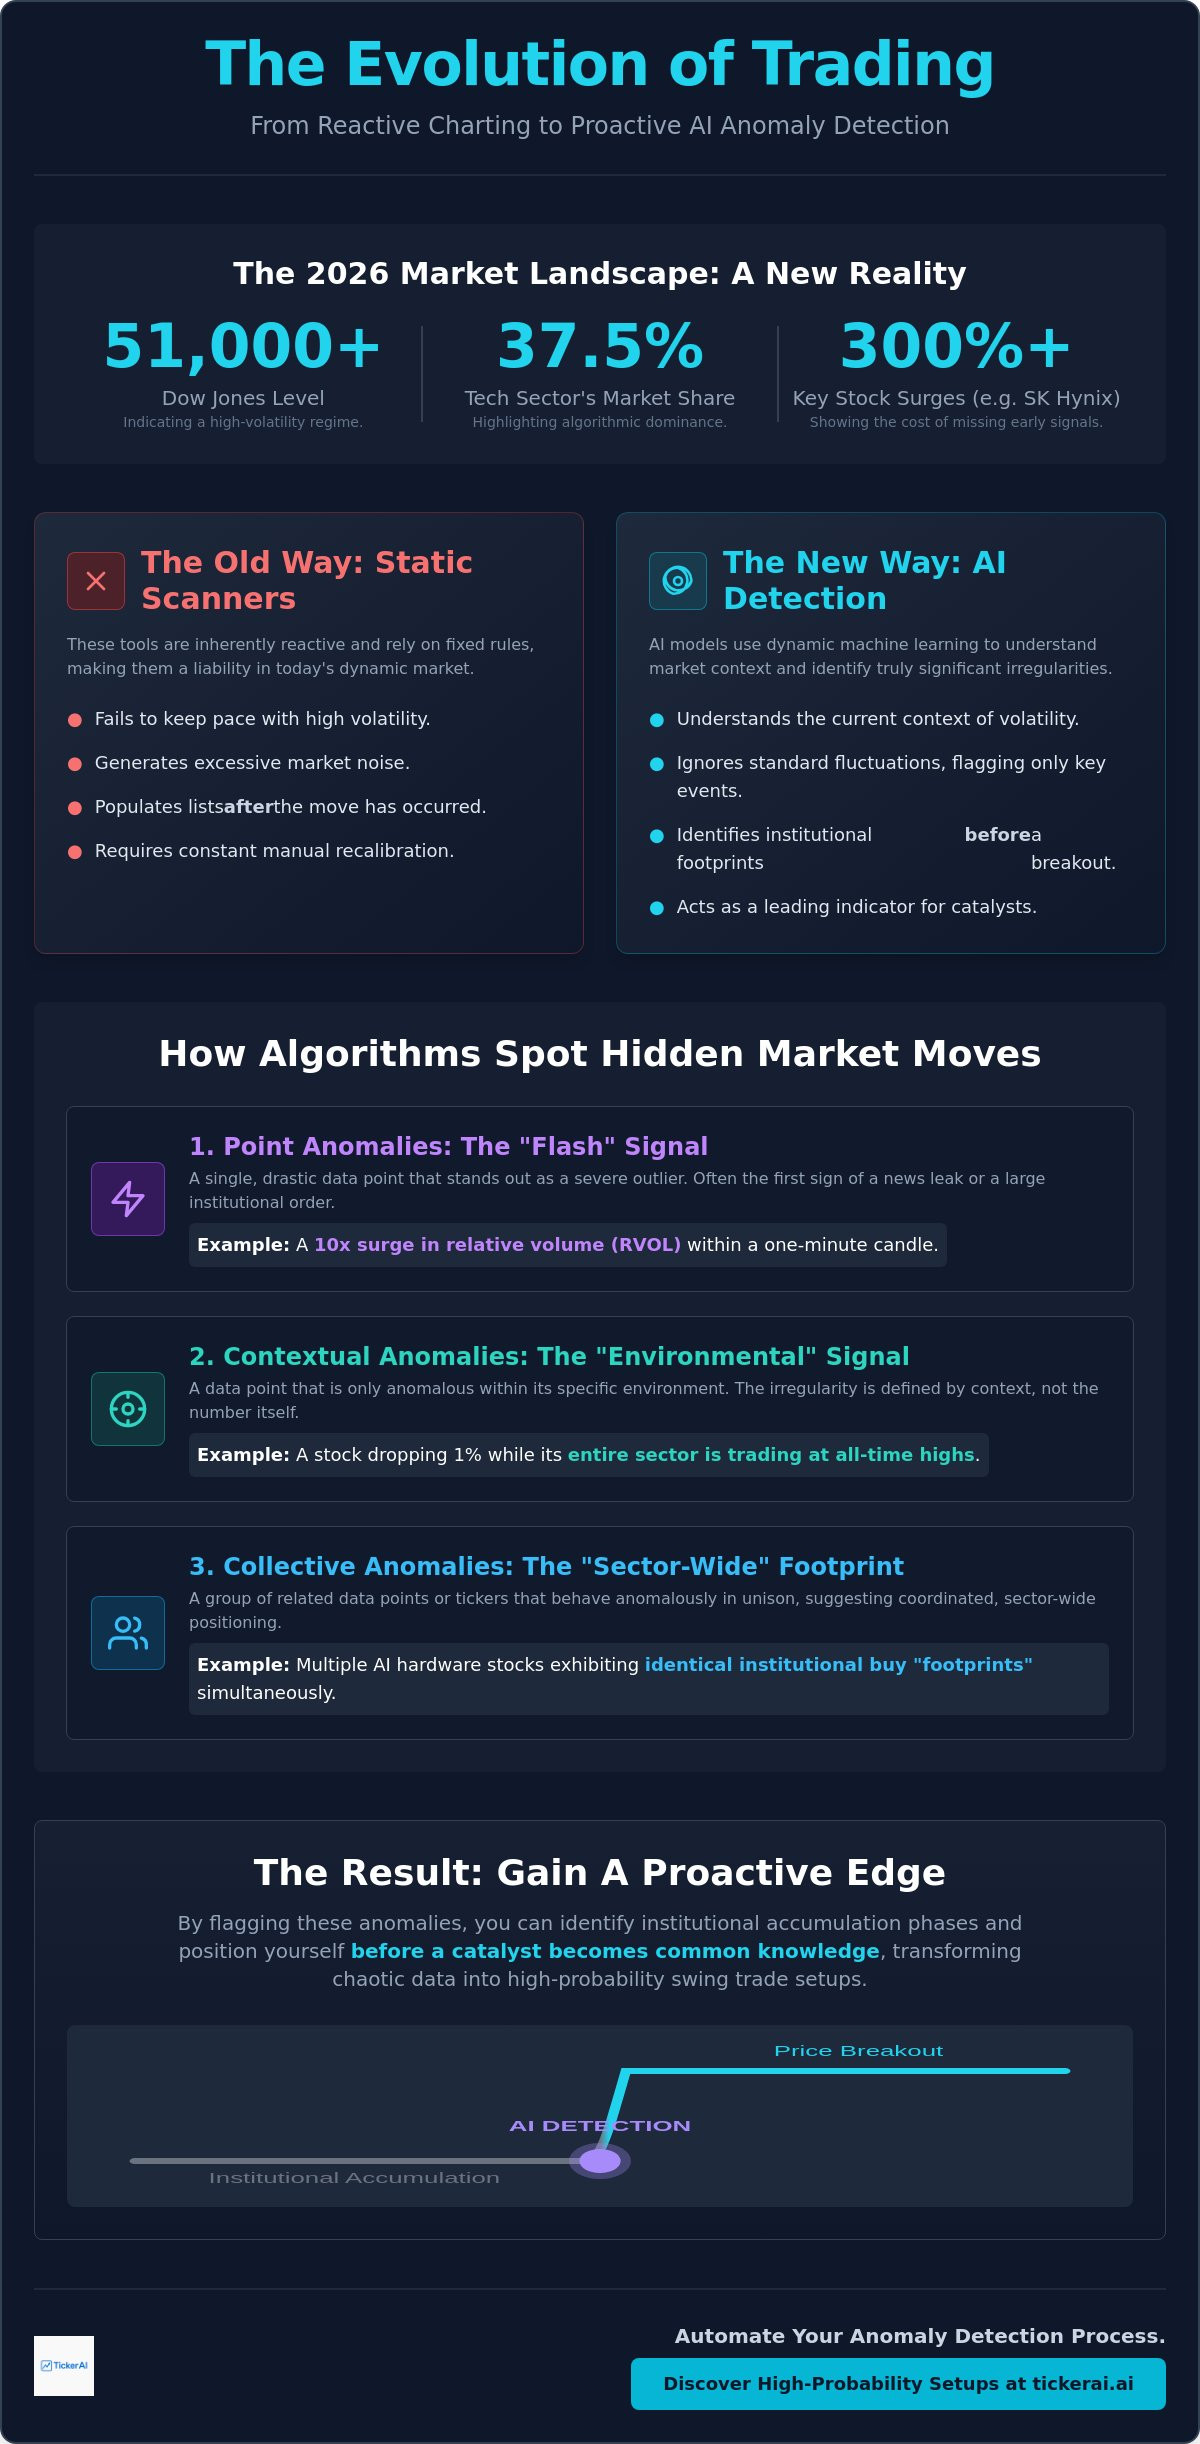
In a market where the Dow Jones has breached 51,000 and the technology sector accounts for 37.5% of the total US market, traditional charting isn't an edge. It's a liability. Professional traders are no longer searching for patterns; they are hunting for irregularities. The shift toward AI-powered stock anomaly detection has moved from a luxury to a necessity for anyone seeking alpha in 2026. This technology identifies institutional footprints and volume surges long before they appear on a standard retail scanner.
You already know the frustration of missing a breakout move because you were buried in manual research. Information overload makes it nearly impossible to distinguish genuine signals from daily market noise. We understand that your time is your most valuable asset. This article demonstrates how advanced algorithmic detection transforms chaotic data into high-probability trade setups. You'll discover a repeatable workflow that reduces research hours and builds higher confidence in your momentum signals. It's time to stop reacting to the tape and start anticipating the move.
Key Takeaways
- Learn how the transition from static rule-based filters to dynamic machine learning models allows for the identification of subtle market irregularities that manual scanning misses.
- Master the distinction between point and contextual anomalies to accurately identify smart money accumulation and momentum ignition phases.
- Build a systematic execution framework by cross-referencing AI-powered stock anomaly detection alerts with fundamental catalysts to eliminate market noise.
- Understand the institutional shift toward algorithmic surveillance and how individual traders can use these same tools to discover high-probability swing trade setups.
- Discover how to automate your discovery process using high-speed intelligence tools that scan thousands of tickers per second for actionable irregularities.
Beyond the Chart: What is AI-Powered Stock Anomaly Detection?
The 2026 equity market is defined by extreme concentration and algorithmic dominance. With the technology sector now representing 37.5% of the US stock market, price action is no longer a simple reflection of retail sentiment. It's a complex web of high-frequency flows and institutional positioning. To find alpha, professional traders are moving beyond standard technical analysis. They are utilizing AI-powered stock anomaly detection to identify data points that deviate from a security’s historical or sector-peer baseline.
This approach moves the focus from what happened to what is beginning to happen. The objective is the discovery of asymmetric information. You are looking for the signal that exists before a catalyst becomes common knowledge. In a market where semiconductor stocks like SK Hynix have surged over 300% in the first half of the year, catching the start of the move is the difference between professional gains and retail exit-liquidity. Real-time detection is the only way to compete with the mass deployment of State Space Models (SSMs) currently being used by high-frequency firms.
The Death of Static Scanners
Traditional scanners are failing because they are inherently reactive. Most "top gainer" lists are populated only after the majority of the price move has already occurred. These tools rely on fixed, rule-based filters that cannot keep pace with the 2026 volatility regime. When the Dow Jones is trading above 51,000, a standard 2% alert is often just market noise. It doesn't tell you if the move is significant.
AI models are dynamic rather than static. They don't require manual recalibration every time market conditions shift. Instead, they use machine learning to understand the current "context" of volatility. This allows the system to ignore standard fluctuations while flagging truly irregular activity that suggests a structural shift in a stock's supply and demand. It's a move from rigid rules to fluid intelligence.
Anomalies as Leading Indicators
Effective anomaly detection distinguishes between price outliers and volume irregularities. A sudden price spike on low volume is usually a trap. However, a volume anomaly that occurs while price remains relatively stable is often the footprint of institutional accumulation. These irregular patterns frequently precede major news catalysts, regulatory shifts, or earnings surprises.
By monitoring these leading indicators, traders can position themselves before the breakout occurs. Anomaly detection provides a definitive pre-breakout signal by flagging institutional accumulation phases before they trigger traditional technical alerts. This proactive stance is essential for navigating the current shift from AI software to the hardware infrastructure that is dominating the 2026 tape.
The Mechanics of Discovery: How Algorithms Spot Hidden Market Moves
Discovery in the 2026 market isn't a product of luck. It's a result of mathematical precision. While retail traders stare at lagging indicators, AI-powered stock anomaly detection engines categorize market irregularities into three distinct classes. Understanding these mechanics is the first step toward filtering noise and identifying genuine alpha.
- Point Anomalies: These are the "flash" signals. A single data point, such as a 10x surge in relative volume (RVOL) within a one-minute candle, represents a drastic outlier. It's often the first sign of a news leak or an institutional sweep.
- Contextual Anomalies: These are more sophisticated. A 1% price drop might be normal during a broad market correction. However, that same 1% drop is an anomaly if it occurs while the stock's sector-peers are trading at all-time highs. The irregularity is defined by the environment, not the number itself.
- Collective Anomalies: This involves spotting groups of related tickers moving in unison. If multiple hardware-focused AI stocks exhibit identical "footprint" buy orders, it suggests sector-wide institutional positioning.
Unsupervised learning plays a critical role here. Unlike traditional systems that look for predefined patterns, unsupervised models identify "unknown unknowns." They flag data that simply doesn't belong, allowing traders to detect new types of market manipulation or accumulation before they've been labeled by the mainstream media.
Data Inputs for 2026 Detection Models
Modern models prioritize price action and RVOL, but they don't stop there. Speed is the priority. High-performance workflows now integrate AI for quantitative stock analysis to cross-reference price anomalies with recent SEC filings in milliseconds. If a volume spike occurs simultaneously with an obscure Form 4 filing, the probability of a sustained move increases. Sentiment analysis provides the final filter. When price action contradicts a bearish social media consensus, it often signals a massive short-squeeze candidate.
Machine Learning Models in Action
The heavy lifting is done by specialized architectures like Isolation Forests. These models work by "isolating" outliers in high-dimensional data; the fewer steps it takes to isolate a point, the more anomalous it is. Recurrent Neural Networks (RNNs) then handle the time-series forecasting. They analyze the sequence of trades to determine if current behavior deviates from the expected trend. Success depends on feature engineering. By transforming raw data into specific metrics, such as the distance from a moving average relative to sector volatility, algorithms can pinpoint the exact moment momentum ignites. To stay ahead of these shifts, many professionals use smart watchlist alerts to monitor these technical deviations in real-time.
Institutional Surveillance vs. Individual Alpha
Institutions use AI to maintain order. Traders use it to exploit chaos. For regulatory bodies and Tier-1 banks, AI-powered stock anomaly detection is a defensive tool. Their focus is on market surveillance; detecting wash trading, preventing fraud, and ensuring compliance with the 2026 FINRA Annual Regulatory Oversight Report mandates. They scan for "bad" data to mitigate risk. As a trader, your objective is the opposite. You are hunting for "irregular" data to capture profit.
The difference lies in the application of the signal. While a compliance algorithm flags an outlier to stop a trade, an opportunity discovery engine flags it to initiate one. This shift from defensive surveillance to offensive alpha discovery is the primary driver of modern outperformance. In a market where 21% of S&P 500 companies now explicitly cite AI benefits in their filings, identifying the footprints of institutional movement is more critical than ever.
Leveling the Playing Field
The democratization of algorithmic signals has stripped away the institutional monopoly on high-speed data. Platforms like TickerAI provide individual participants with the same detection capabilities once reserved for quant desks. Speed remains your greatest advantage. Large funds often struggle with liquidity constraints and "slippage" when reacting to anomaly alerts. Their size makes them slow. You can execute on a momentum ignition signal while a multi-billion dollar fund is still clearing its compliance hurdles.
Transparency is the antidote to the "Black Box" problem. Modern detection tools don't just provide a buy alert; they report the specific deviation that triggered the signal. Whether it's a contextual volume surge or a price-sentiment divergence, seeing the logic behind the alert builds the confidence necessary for high-conviction execution. Agility, paired with institutional-grade intelligence, creates a significant edge.
Identifying Smart Money Flow
Institutional "smart money" rarely enters a position in a single, visible candle. They use "stealth" accumulation patterns, breaking large orders into smaller blocks to avoid moving the price prematurely. However, these block trades still create subtle volume anomalies that machine learning models can isolate. By flagging these footprints, you can identify where big money is positioning before the mainstream media reports the story.
Detecting these irregularities allows you to validate a systematic approach to stock investing. Instead of guessing, you are reacting to verifiable data deviations. Anomaly detection identifies the exact moment when institutional accumulation transitions into momentum ignition. It's the difference between being early to a move and being exit-liquidity for the pros.
Implementation: Building a Systematic Workflow Around Anomaly Alerts
Systematic execution is what separates a professional trader from a participant chasing ghosts. While AI-powered stock anomaly detection provides the raw intelligence, your workflow determines the profitability. You need a modular process to filter high-frequency churn and isolate high-probability setups. This isn't about looking at every alert. It's about executing on the ones that align with a broader market thesis.
- Step 1: Define Discovery Parameters. In the 2026 environment, focus on the infrastructure driving the Dow Jones toward its 51,000 milestones. Set your scanners to monitor specific market cap ranges, primarily mid to large-cap hardware manufacturers, to ensure sufficient liquidity for professional execution.
- Step 2: Cross-Reference with Catalysts. An anomaly without a fundamental reason is often just a statistical glitch. Check for upcoming earnings, patent filings, or supply chain shifts. If the machine flags a volume surge and you find a corresponding SEC filing, the signal strength doubles.
- Step 3: Multi-Timeframe Validation. A five-minute anomaly is noise unless it aligns with a daily or weekly trend. Ensure the micro-irregularity supports a macro-breakout before committing capital.
- Step 4: Execute with Precision. Place entry orders only when the price confirms the anomaly's direction. Use strict risk parameters to remove emotion from the trade.
- Step 5: Review and Journal. Every alert is a data point. Journaling your trades allows you to refine your interpretation of algorithmic signals and improve your hit rate over time.
Filtering for Actionable Ideas
Approximately 90% of all market anomalies are statistical noise. Finding the 10% that lead to significant price moves requires a refined filtering process. Utilize Smart Watchlist & Alerts to organize high-potential discoveries by sector and conviction level. This prevents analysis paralysis by presenting only the most relevant data for your specific trading style. Real-time alerts allow you to stop scanning and start deciding.
Risk Management for Algorithmic Signals
Confidence in a signal does not justify reckless exposure. Set your initial stop-loss at the low of the "anomaly candle" that triggered the alert. This provides a clear technical invalidation point. If the price breaches this low, the institutional footprint was either false or has already been absorbed. Position sizing should be calculated based on this risk distance, ensuring no single trade compromises your capital. Anomaly detection requires a disciplined exit strategy because rapid algorithmic moves can reverse just as quickly as they ignite.
TickerAI: Automating Anomaly Detection for Professional Discovery
Manual market scanning is a relic of a slower era. In the 2026 environment, where institutional algorithms execute in microseconds, your discovery process must be equally relentless. TickerAI replaces hours of manual charting with a high-speed intelligence engine that scans thousands of tickers every second. By utilizing AI-powered stock anomaly detection, the platform identifies irregularities in price action, volume, and sentiment before they hit mainstream scanners. You don't just see the move; you see the institutional footprint that creates it.
The transition from manual research to AI-driven discovery is about reclaiming your time. Instead of searching for setups, you act as the final filter for high-probability signals. TickerAI Pro provides real-time alerts on high-potential swing trade setups, allowing you to focus on execution rather than data entry. It's a proactive approach to a market that rewards speed and precision over exhaustive, outdated research methods.
The TickerAI Methodology
Our engine utilizes a proprietary blend of technical, fundamental, and sentiment anomaly detection. We don't just flag price spikes. We analyze whether a move is supported by underlying fundamental catalysts or if it's a "pump and dump" anomaly designed to trap retail liquidity. Our models filter out the noise, ensuring that the alerts you receive represent structural shifts in supply and demand. For those requiring a deeper perspective, the TickerAI Full-Access Subscription provides comprehensive deep-dives into long-term investment ideas based on these detected signals. This ensures your portfolio is built on a foundation of data, not speculation.
Get Started with Algorithmic Alpha
Success in 2026 requires a tool that matches your trading frequency. If you are focused on capturing rapid price movements, the TickerAI Pro Subscription offers the real-time agility necessary for swing trading. For investors seeking a more comprehensive view, our Full-Access tier integrates deep-dive research with our discovery engine. Both tiers are designed to integrate seamlessly into your existing brokerage workflow. You can customize smart watchlists to match your specific sector themes, ensuring the machine only flags what is relevant to your strategy. Stop chasing the tape. Start anticipating it.
Discover your next trade setup with TickerAI Full-Access
Secure Your Algorithmic Advantage
The 2026 market doesn't wait for manual confirmation. Success depends on your ability to scan 6,000+ tickers for the specific irregularities that signal institutional accumulation. By implementing AI-powered stock anomaly detection, you move beyond the limitations of static charts. You transition from a reactive observer to a proactive participant who identifies momentum ignition before the breakout occurs. This systematic approach ensures that your capital is deployed only when the probability of alpha is at its peak.
Efficiency is the ultimate edge. TickerAI provides the high-speed intelligence necessary to navigate today's volatility with clinical precision. With curated swing trade setups and Smart Watchlist integration for thematic discovery, you can stop fighting the noise and start following the data. It's time to leverage professional-grade tools to protect your time and maximize your execution. The market is moving fast; with the right intelligence, you're always positioned for the next move.
Upgrade to TickerAI Pro for Real-Time Anomaly Alerts
Frequently Asked Questions
What is an anomaly in stock market data?
An anomaly is a data point or pattern that deviates significantly from a security's historical baseline or its sector-peer group. In the 2026 market, these irregularities represent the footprints of institutional movement. Common examples include extreme relative volume (RVOL) surges or price action that detaches from broader sector trends. Detecting these deviations allows traders to identify potential momentum shifts before they become common knowledge on retail scanners.
How does AI-powered anomaly detection differ from a standard stock screener?
Standard screeners rely on static, rule-based filters that require manual recalibration as market conditions shift. In contrast, AI-powered stock anomaly detection utilizes machine learning to understand the current market regime. It identifies irregularities based on dynamic context rather than fixed percentages. This allows the system to ignore standard market noise while flagging structural shifts that traditional, rigid scanners would miss entirely. It's the transition from reactive filtering to proactive intelligence.
Can anomaly detection predict stock market crashes?
Anomaly detection identifies systemic irregularities that often precede significant market corrections. While no tool can predict the future with absolute certainty, detecting collective anomalies across multiple sectors can signal institutional de-risking. By monitoring these structural detours, traders can identify when the market's internal mechanics are breaking down. This provides a data-driven warning signal that is often visible long before the price action triggers a broad market panic.
Is AI-powered anomaly detection suitable for day trading or swing trading?
This technology is highly versatile and supports both styles of execution. Day traders utilize real-time point anomalies to capture intraday volatility spikes. Swing traders benefit most from identifying contextual anomalies that suggest institutional accumulation over several days. TickerAI optimizes this process by providing curated swing trade setups that align with multi-day momentum trends. It reduces the time spent on manual research while increasing confidence in mid-term positioning.
Do I need coding skills to use an AI stock anomaly detection tool?
Coding skills are not required to utilize professional detection platforms. Tools like TickerAI are designed to act as a high-tech assistant, handling the algorithmic processing and data filtering for you. You receive clear, actionable alerts and curated watchlists through a streamlined interface. This allows you to focus on decision-making and execution rather than managing machine learning models or writing complex scripts to parse market data.
How accurate are AI-powered stock alerts in 2026?
Accuracy in 2026 is driven by the integration of multi-factor data points. Modern models reduce false positives by cross-referencing price anomalies with real-time sentiment and SEC filings. While no algorithmic signal is perfect, these systems provide a significantly higher signal-to-noise ratio than traditional technical analysis. Accuracy is further improved by the mass deployment of State Space Models (SSMs), which allow for faster and more precise processing of high-frequency market data.
What are the main types of anomalies traders should watch for?
Traders should prioritize three main categories: point, contextual, and collective anomalies. Point anomalies are single, drastic outliers in volume or price. Contextual anomalies occur when a stock deviates from its sector-peer performance. Collective anomalies involve groups of stocks moving in a coordinated fashion that suggests institutional sector rotation. Monitoring these types of irregularities provides a comprehensive view of where smart money is positioning and where momentum is likely to ignite.
Is TickerAI considered a personal financial advisor?
TickerAI is an information technology platform, not a personal financial advisor. We provide data-driven discovery tools, trade setups, and smart alerts to assist your research process. We don't offer custom trading coaching, brokerage execution, or individualized financial planning. All investment decisions are the sole responsibility of the user. We recommend consulting with a licensed professional for specific financial advice tailored to your personal circumstances and risk tolerance.