

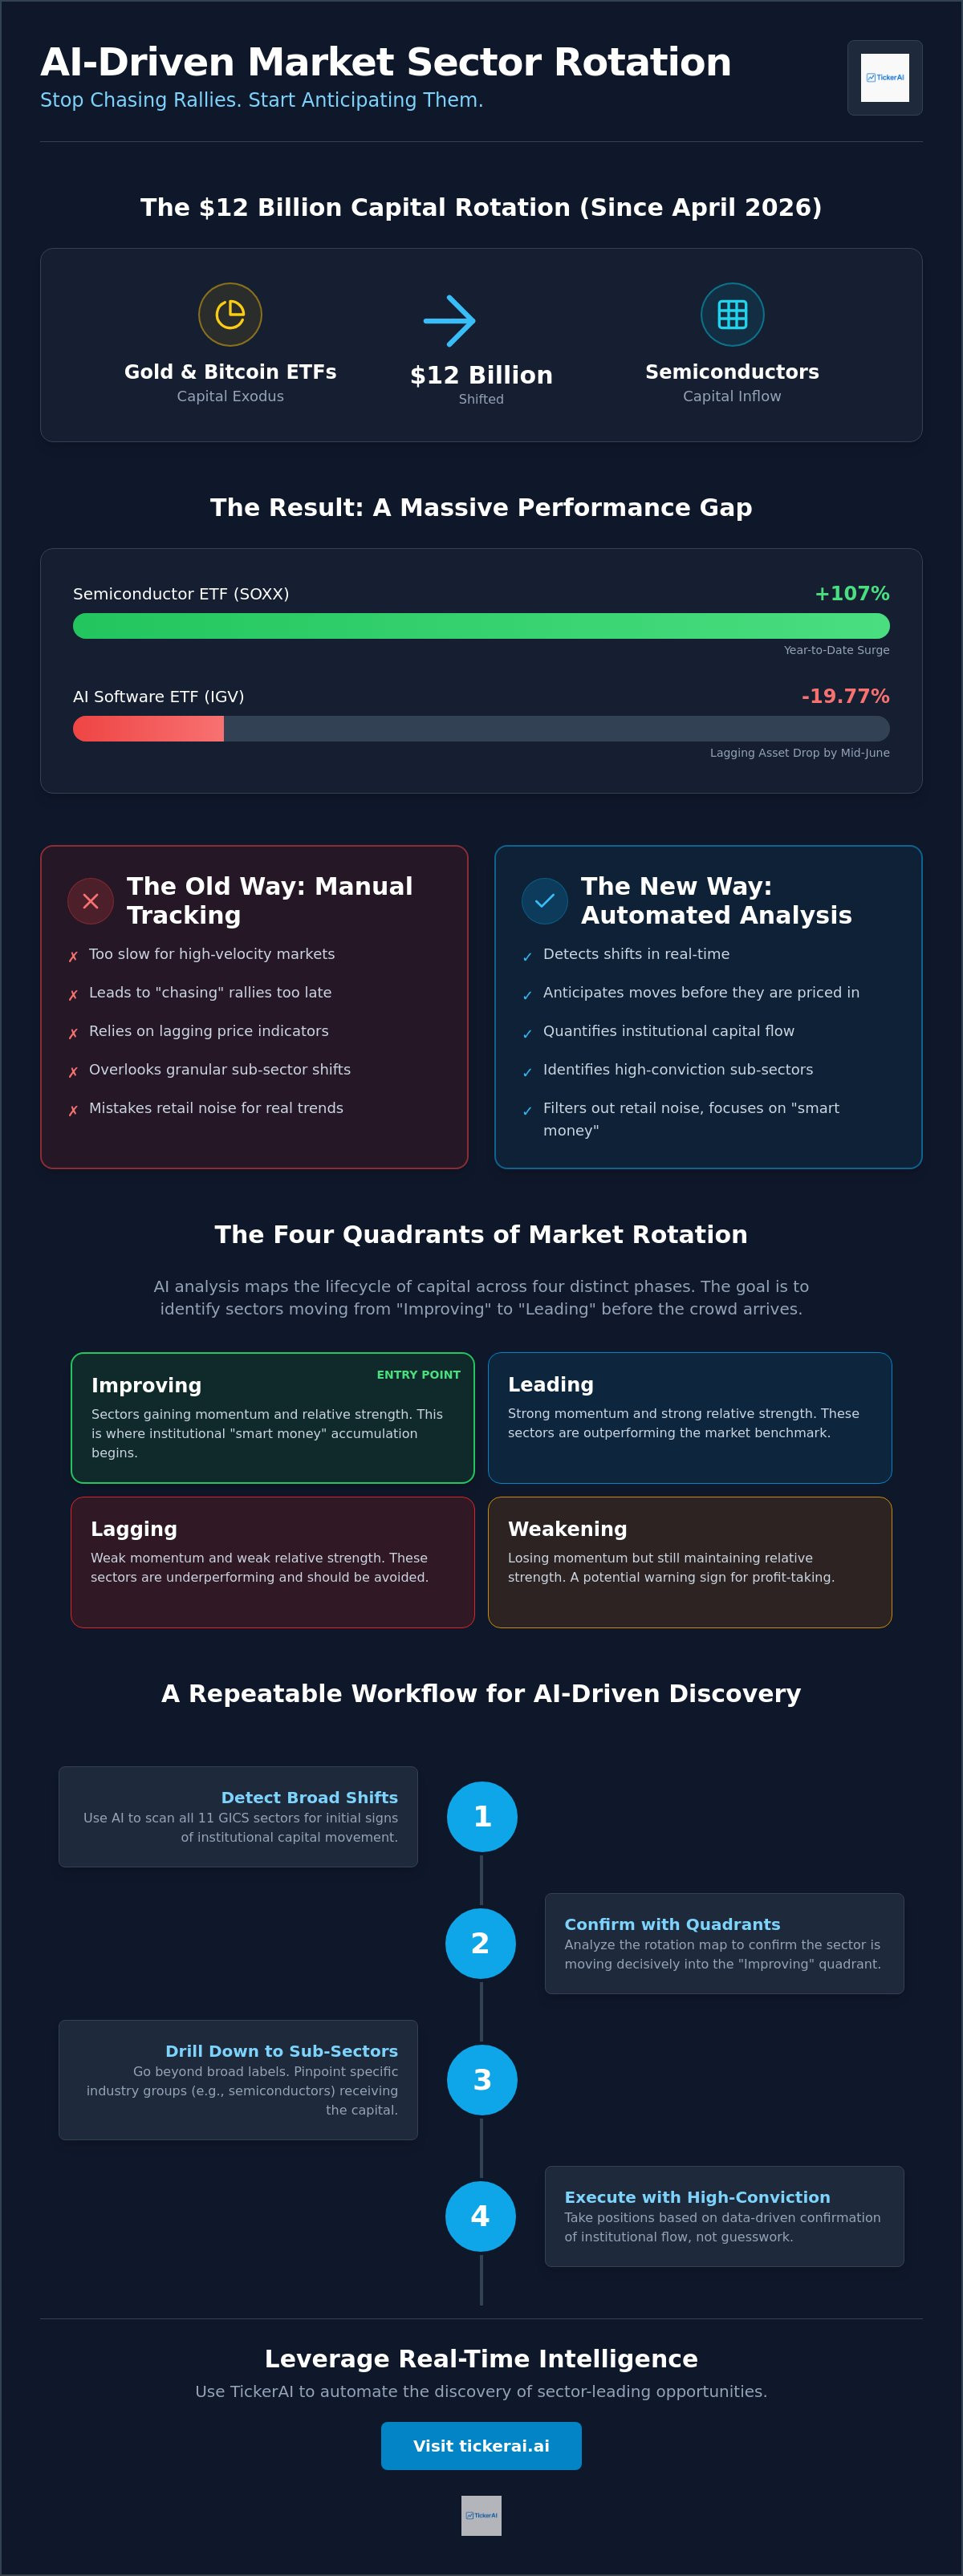
Since April 2026, over $12 billion in capital has rotated out of Gold and Bitcoin ETFs and straight into semiconductors. This massive shift left many traders holding lagging software assets while the SOXX ETF surged 107% year-to-date. Using automated market sector rotation analysis is now the only way to catch these moves before they're fully priced in. You've likely felt the frustration of missing the initial 10% of a rally because you were buried in the noise of 11 different GICS sectors. Manual monitoring is simply too slow for the current pace of institutional flow.
This article shows you how AI-driven analysis identifies capital shifts before they reflect in broader market pricing. You'll discover how to move beyond information overload and gain a clinical, data-driven view of market leadership. We will preview a repeatable workflow for rotating capital based on confirmed institutional movement. This guide provides the technical roadmap to stop chasing rallies and start anticipating them with professional-grade intelligence. It's time to replace manual guesswork with high-speed algorithmic detection.
Key Takeaways
- Stop chasing rallies. Understand why manual GICS tracking is insufficient for the high-velocity, algorithmic capital shifts defining the 2026 market.
- Master the rotation quadrants. Learn to identify the critical transition from "Improving" to "Leading" sectors using Relative Strength Momentum.
- Quantify institutional flow. Implement automated market sector rotation analysis to filter out "mean reversion" traps and focus on high-conviction sectors.
- Streamline your execution. Follow a repeatable, data-driven workflow to drill down from broad sector leadership to specific industry group opportunities.
- Leverage real-time intelligence. Use TickerAI alerts to detect institutional shifts before they are fully reflected in broader market pricing.
The Velocity of 2026 Markets: Why Manual Sector Tracking Fails
The 2026 market environment has rendered traditional, manual tracking methods obsolete. While classic sector rotation theory suggests a slow migration based on economic cycles, today's reality is driven by high-frequency algorithmic reallocation. Institutional capital no longer waits for quarterly rebalancing. It shifts in real-time. Since April 2026, we've witnessed a massive $12 billion exodus from Gold and Bitcoin ETFs into semiconductor ETFs. Traders relying on manual spreadsheets or lagging news feeds missed the bulk of the SOXX ETF’s 107% year-to-date surge. The speed of execution has outpaced human observation.
Manual tracking inevitably leads to "chasing." By the time a sector’s strength is obvious on a standard price chart, the smart money has already established its core positions. Price action is a lagging indicator of institutional intent. It's the final result of a decision made days or weeks prior. Holding laggards like the AI Software ETF (IGV), which dropped 19.77% by mid-June 2026 while semiconductors soared, represents a massive opportunity cost. High-velocity markets demand automated market sector rotation analysis to detect these deviations before they become mainstream headlines. Efficiency is the only hedge against volatility.
The 11 GICS Sectors in the AI Era
The Global Industry Classification Standard (GICS) provides a necessary map, but its 11 sectors are increasingly porous. In 2026, themes like AI and the Energy Transition blur traditional lines. A utility company powering an AI data center might trade more like a tech stock than a traditional defensive play. Relying on broad sector labels is a recipe for mediocrity. True alpha discovery requires granular sub-sector analysis. You must look past the surface to see where the specific capital is landing. Automated systems scan these sub-layers instantly, identifying strength in niches that manual filters often overlook.
Institutional Footprints vs. Retail Noise
Retail traders often enter a sector at the point of exhaustion. They react to price spikes and media hype. Institutions, however, leave footprints in volume-weighted rotation metrics long before the price peak. Using automated market sector rotation analysis allows you to filter the noise and focus on these footprints.
- Smart Money Flow: Detected through accumulation patterns in "Improving" quadrants.
- Retail Noise: Characterized by high-volume buying at the top of a "Leading" phase.
- Strategic Edge: Early detection of institutional shifts provides a data-driven confirmation of flow.
This clinical approach allows for proactive positioning. It moves you from a reactive participant to a calculated observer of institutional flow. The gap between the 107% gain in semiconductors and the 19.77% loss in AI software illustrates the stakes. Precision isn't optional; it's the baseline for performance in a professional environment.
Mechanics of Automated Market Sector Rotation Analysis
Understanding institutional movement requires a structured mathematical framework rather than visual guesswork. Automated market sector rotation analysis relies on a four-quadrant phase space to map the lifecycle of capital. These quadrants—Leading, Weakening, Lagging, and Improving—categorize every sector based on its relationship to a benchmark. A sector's position is determined using an automated sector rotation methodology that prioritizes statistical precision over subjective chart reading. While most participants focus on where a sector sits today, the real predictive power lies in the velocity of movement within the quadrant. A sector accelerating rapidly through the "Improving" phase often offers a higher-conviction entry than a stagnant leader.
The math of rotation is unforgiving. Professionals don't just look for what is "up" or "down." They look for the vector. The direction and speed of a sector's "trail" on a rotation map reveal the intensity of institutional accumulation. If the trail is long and moving decisively toward the "Leading" quadrant, it confirms sustained buying pressure. If the trail is short and erratic, it indicates retail noise or indecision. By quantifying these movements, you can identify which themes are gaining genuine traction before they dominate the daily headlines. Precision is the priority.
Relative Strength vs. Momentum: A Critical Distinction
Relative Strength (RS) measures a sector's performance against a broad benchmark, such as the S&P 500 or VTI. It identifies the current winners. Relative Strength Momentum (RSM) measures the rate of change in that relative performance. It identifies how fast those winners are accelerating. This distinction is vital for risk management. A primary sell signal occurs when a sector shows high RS but declining RSM. This divergence indicates that while the sector is still outperforming, the institutional "engine" is losing steam. You can monitor these momentum shifts in real-time to avoid the exhaustion phase of a rally. Identifying these shifts manually is impossible in high-speed markets.
Algorithmic Phase Detection
AI removes the human bias that often plagues technical analysis. Algorithms calculate the statistical probability of a sector transitioning between quadrants, eliminating emotional hesitation. This process involves "trail" analysis, which tracks the historical path of a sector over specific look-back periods. A straight, northeast trajectory suggests high-conviction institutional flow. Conversely, a hook-shaped trail often precedes a trend reversal. By automating this detection, you aren't just watching a sector; you're quantifying its trajectory. This systematic approach ensures capital is rotated based on confirmed data rather than hopeful speculation. It transforms a chaotic environment into a series of calculated steps.
Beyond Price: Quantifying Institutional Flow and Factor Models
Price action is merely the surface of market movement. To anticipate institutional shifts, you must look at the underlying mechanics that drive capital. Institutions reallocate billions based on multi-factor models that prioritize fundamental value alongside technical momentum. Relying solely on price often leads traders into the "Mean Reversion" trap. This occurs when a sector appears "cheap" on a valuation basis but continues to lag because it lacks a growth catalyst or institutional support. Professional automated market sector rotation analysis avoids these traps by requiring confirmation from both factor models and momentum trails. The strongest rotations occur when fundamental value meets accelerating technical momentum.
Tracking institutional "dark pool" activity provides a critical precursor to these shifts. These private exchanges hide large-scale accumulation from the retail eye until the move is already underway. By the time volume spikes on public exchanges, the most profitable entry point has often passed. Algorithms now scan for these footprints, identifying where "Smart Money" is positioning itself before the trend becomes obvious. This clinical approach ensures you aren't just reacting to the market; you're aligning with the forces that move it. Efficiency in 2026 is defined by the ability to see through the noise of daily price fluctuations.
Factor Analysis: PE, Yield, and Growth
AI weights fundamental factors differently depending on the current economic cycle. In a high-rate environment, debt-to-equity ratios and cash flow take precedence. During expansionary phases, growth and enterprise value (EV/EBITDA) lead the rotation. A Factor Model is a mathematical framework that attributes sector performance to specific underlying characteristics like valuation, volatility, and quality. Using interpretable machine learning for sector analysis, these models provide transparency into why a rotation is occurring. This diagnostic capability allows you to distinguish between a temporary bounce and a sustained institutional shift.
Sentiment and Macro Catalysts
Macro catalysts are the primary drivers of market velocity. Fed narratives and interest rate projections can shift billions of dollars in seconds, as seen with the $12 billion rotation into semiconductors earlier this year. Manual analysis cannot process the sheer volume of sentiment data required to stay ahead of these shifts. Algorithms now quantify market sentiment to identify "overcrowded" trades, where the risk of a sharp reversal is highest. By integrating automated growth stock screening into your thematic rotation, you ensure that your capital is positioned in sectors with both institutional support and fundamental upside. This systematic integration is what separates high-performance strategies from casual speculation.
Executing the Rotation: A Workflow for AI-Driven Discovery
Execution is the final barrier between raw data and realized profit. In 2026, a manual approach to capital reallocation is a liability. Institutional algorithms operate on millisecond timescales; your workflow must match that precision. A systematic automated market sector rotation analysis replaces subjective chart reading with a clinical, five-step execution model. This process ensures that capital is always positioned in the path of least resistance, moving from stagnant laggards into high-velocity leaders before the retail crowd arrives.
- Step 1: Scan for 'Improving' Sectors. Filter for sectors entering the northeast quadrant with accelerating RS Momentum. This is the accumulation phase.
- Step 2: Drill Into Industry Groups. A leading sector often hides internal divergence. Identify the specific sub-industries driving the move.
- Step 3: Filter for High-Conviction Setups. Use AI discovery to isolate tickers with technical and fundamental alignment. Focus on setups with clear institutional footprints.
- Step 4: Set Automated Alerts. Quadrant shifts are critical triggers. Configure notifications for when a sector moves from "Leading" to "Weakening" to protect gains.
- Step 5: Execute with Risk Parameters. Predefine stop-losses and position sizing before entry. Discipline is the foundation of high-speed trading.
Efficiency defines the professional trader. You can access institutional-grade rotation alerts to automate this entire discovery process. By removing the need for manual trail scanning, you focus exclusively on decision-making and execution. This modular workflow transforms a chaotic market into a series of calculated, high-probability steps.
Drilling Down: From Sector to Stock
A leading sector provides the tailwind, but it does not guarantee that every constituent stock will outperform. Some equities remain tethered to legacy hurdles even while their industry peers soar. Identifying the "pure play" stocks that best represent the sector theme is essential for maximizing alpha. This often involves looking beyond the mega-cap names that dominate the headlines. Integrating AI-powered small-cap stock discovery allows you to find hidden leaders within a rotation. These stocks often offer higher torque and more aggressive growth profiles than their larger counterparts.
The Exit Strategy: Identifying Exhaustion
Institutional distribution is often subtle. It begins while price is still making new highs, hidden within the "Leading" quadrant as RS Momentum starts to fade. Using automated market sector rotation analysis allows you to spot these "blow-off tops" through anomaly detection. When volume spikes but momentum plateaus, the smart money is exiting. The goal is not to catch the absolute peak, but to rotate capital back into "Improving" sectors as soon as the probability of further upside diminishes. Compounding gains requires the courage to leave a trade when the data suggests the institutional engine is cooling. Observation leads to action; action leads to profit.
TickerAI: Automating the Discovery of Sector-Leading Opportunities
TickerAI serves as the high-speed intelligence partner required to navigate the complexities of 2026 capital flows. While manual analysis collapses under the weight of real-time data, TickerAI’s Full-Access approach provides a clinical, automated market sector rotation analysis that identifies leadership before it becomes common knowledge. It doesn't just display data; it filters it. By prioritizing sectors based on confirmed institutional accumulation, the platform ensures your capital is always aligned with the strongest market vectors. Efficiency is the priority. Guesswork is the enemy.
Organization is the key to execution. TickerAI's Smart Watchlists categorize thematic opportunities by sector strength, allowing you to move between industry groups with surgical precision. This removes the emotional friction inherent in manual rotation tracking. When the data shifts, the platform reflects that change immediately. You aren't left wondering whether a trend is intact; you have the data-driven confirmation required to act. The platform acts as a tireless assistant, scanning and detecting while you focus on the final trade decision.
Real-Time Signal Intelligence
TickerAI’s signal intelligence is built to handle the volatility of the 2026 market. The platform’s Pro-tier discovery is specifically designed for high-frequency rotation shifts, providing an advantage when sectors transition between quadrants in days rather than weeks. Integrating AI stock discovery platform tools ensures a complete technical and fundamental edge. This isn't about following the herd. It's about detecting the movement of the herd before it reaches its destination. Signals are delivered with clinical precision, stripped of the fluff found in traditional financial media.
Systematic Advantage for the Modern Trader
The modern trader cannot scale intelligence through manual effort. Moving from a reactive state to proactive scouting requires a system that is always "on." TickerAI acts as that proactive scout, scanning thousands of data points to prioritize the most lucrative setups. This systematic advantage allows you to focus on high-level decision-making while the algorithm handles the heavy lifting of automated market sector rotation analysis. Scaling your strategy is only possible when you automate the discovery phase. Join TickerAI to automate your sector discovery today.
Dominating Institutional Shifts in 2026
The 2026 market environment doesn't reward hesitation. Manual spreadsheets can't track the $12 billion capital shifts that define today's algorithmic landscape. Success now depends on automated market sector rotation analysis to identify institutional footprints before they reach the retail masses. You've seen how the transition from "Improving" to "Leading" quadrants creates the most significant alpha. By integrating factor models with real-time momentum, you move from reacting to price to anticipating flow. This clinical approach ensures you're always positioned in the path of least resistance.
Efficiency is your primary competitive edge. Scaling your portfolio requires a system that filters noise and prioritizes high-conviction opportunities. TickerAI provides the professional-grade precision needed to execute these rotations without emotional bias. It's time to leverage AI-driven swing trade setups, real-time institutional flow alerts, and professional-grade smart watchlists to stay ahead of the curve. You have the technical roadmap. Now you need the high-speed intelligence partner to execute it.
Scale your market intelligence with TickerAI Full-Access. Position yourself where the capital is moving. The data is ready; the decision is yours.
Frequently Asked Questions
What is automated market sector rotation analysis?
It's a systematic methodology that uses AI and algorithms to track capital movement between the 11 GICS sectors. This process identifies shifts in institutional flow by mapping sectors into specific quadrants such as Leading, Weakening, Lagging, or Improving. By removing manual bias, automated market sector rotation analysis provides a clinical view of where "Smart Money" is positioning itself before those moves reflect in broader price action.
How often do market sectors typically rotate in 2026?
Rotation frequency has accelerated from traditional quarterly rebalancing to near real-time algorithmic shifts. In the 2026 market, major capital reallocations can occur within weeks or even days. A prime example is the $12 billion shift from Gold and Bitcoin into semiconductors observed earlier this year. High-frequency execution by institutions means traders must monitor these rotations daily to avoid holding lagging assets during high-velocity moves.
Is sector rotation a leading or lagging indicator?
Standard price-based rotation is typically a lagging indicator because it reacts to completed moves. However, automated market sector rotation analysis using Relative Strength Momentum (RSM) serves as a leading indicator. It detects the rate of change in institutional accumulation. By identifying sectors in the "Improving" phase while they still have low Relative Strength, you can position your capital before the sector officially enters a "Leading" trend.
Can AI predict which sector will lead the market next?
AI uses predictive modeling to calculate the statistical probability of a sector transitioning between quadrants. By analyzing the "trail" of a sector’s movement and institutional accumulation footprints, algorithms identify themes gaining genuine traction. These systems look for accelerating momentum vectors rather than just high prices. This allows for the discovery of upcoming leadership in the "Improving" quadrant before the retail crowd reacts to the breakout.
What are the best ETFs for tracking sector rotation?
Professionals utilize high-liquidity sector ETFs to monitor and execute rotation strategies. Common instruments include SOXX for semiconductors, XLE for energy, and XLK for technology. These ETFs provide the granular data necessary for AI models to calculate relative strength against benchmarks like the S&P 500. Using these liquid vehicles ensures that entries and exits are executed with minimal slippage during rapid institutional shifts.
How does TickerAI handle sector rotation alerts?
TickerAI monitors quadrant shifts in real-time and issues immediate notifications when a sector’s status changes. These alerts trigger when a sector enters the high-conviction "Improving" phase or shows signs of exhaustion in the "Leading" phase. This systematic approach allows you to reallocate capital based on data-driven confirmation. It replaces the need for manual chart scanning with a proactive, "always-on" intelligence partner.
What is the difference between relative strength and momentum in rotation?
Relative Strength (RS) measures a sector's current performance compared to a benchmark like the S&P 500. Momentum, specifically Relative Strength Momentum (RSM), measures the speed at which that relative performance is changing. A sector can have high RS but declining RSM, which is a primary signal that the trend is exhausting. Professionals prioritize RSM to find sectors that are not just strong, but are actively accelerating.
How do I avoid 'chasing' a sector that has already moved?
Avoid entering sectors that are deep in the "Leading" quadrant with plateauing or declining RSM. These areas represent overcrowded trades where the risk of a reversal is highest. Instead, focus on sectors in the "Improving" quadrant with a clear northeast trajectory. This ensures you're entering at the start of an institutional accumulation phase rather than at the point of retail exhaustion.