

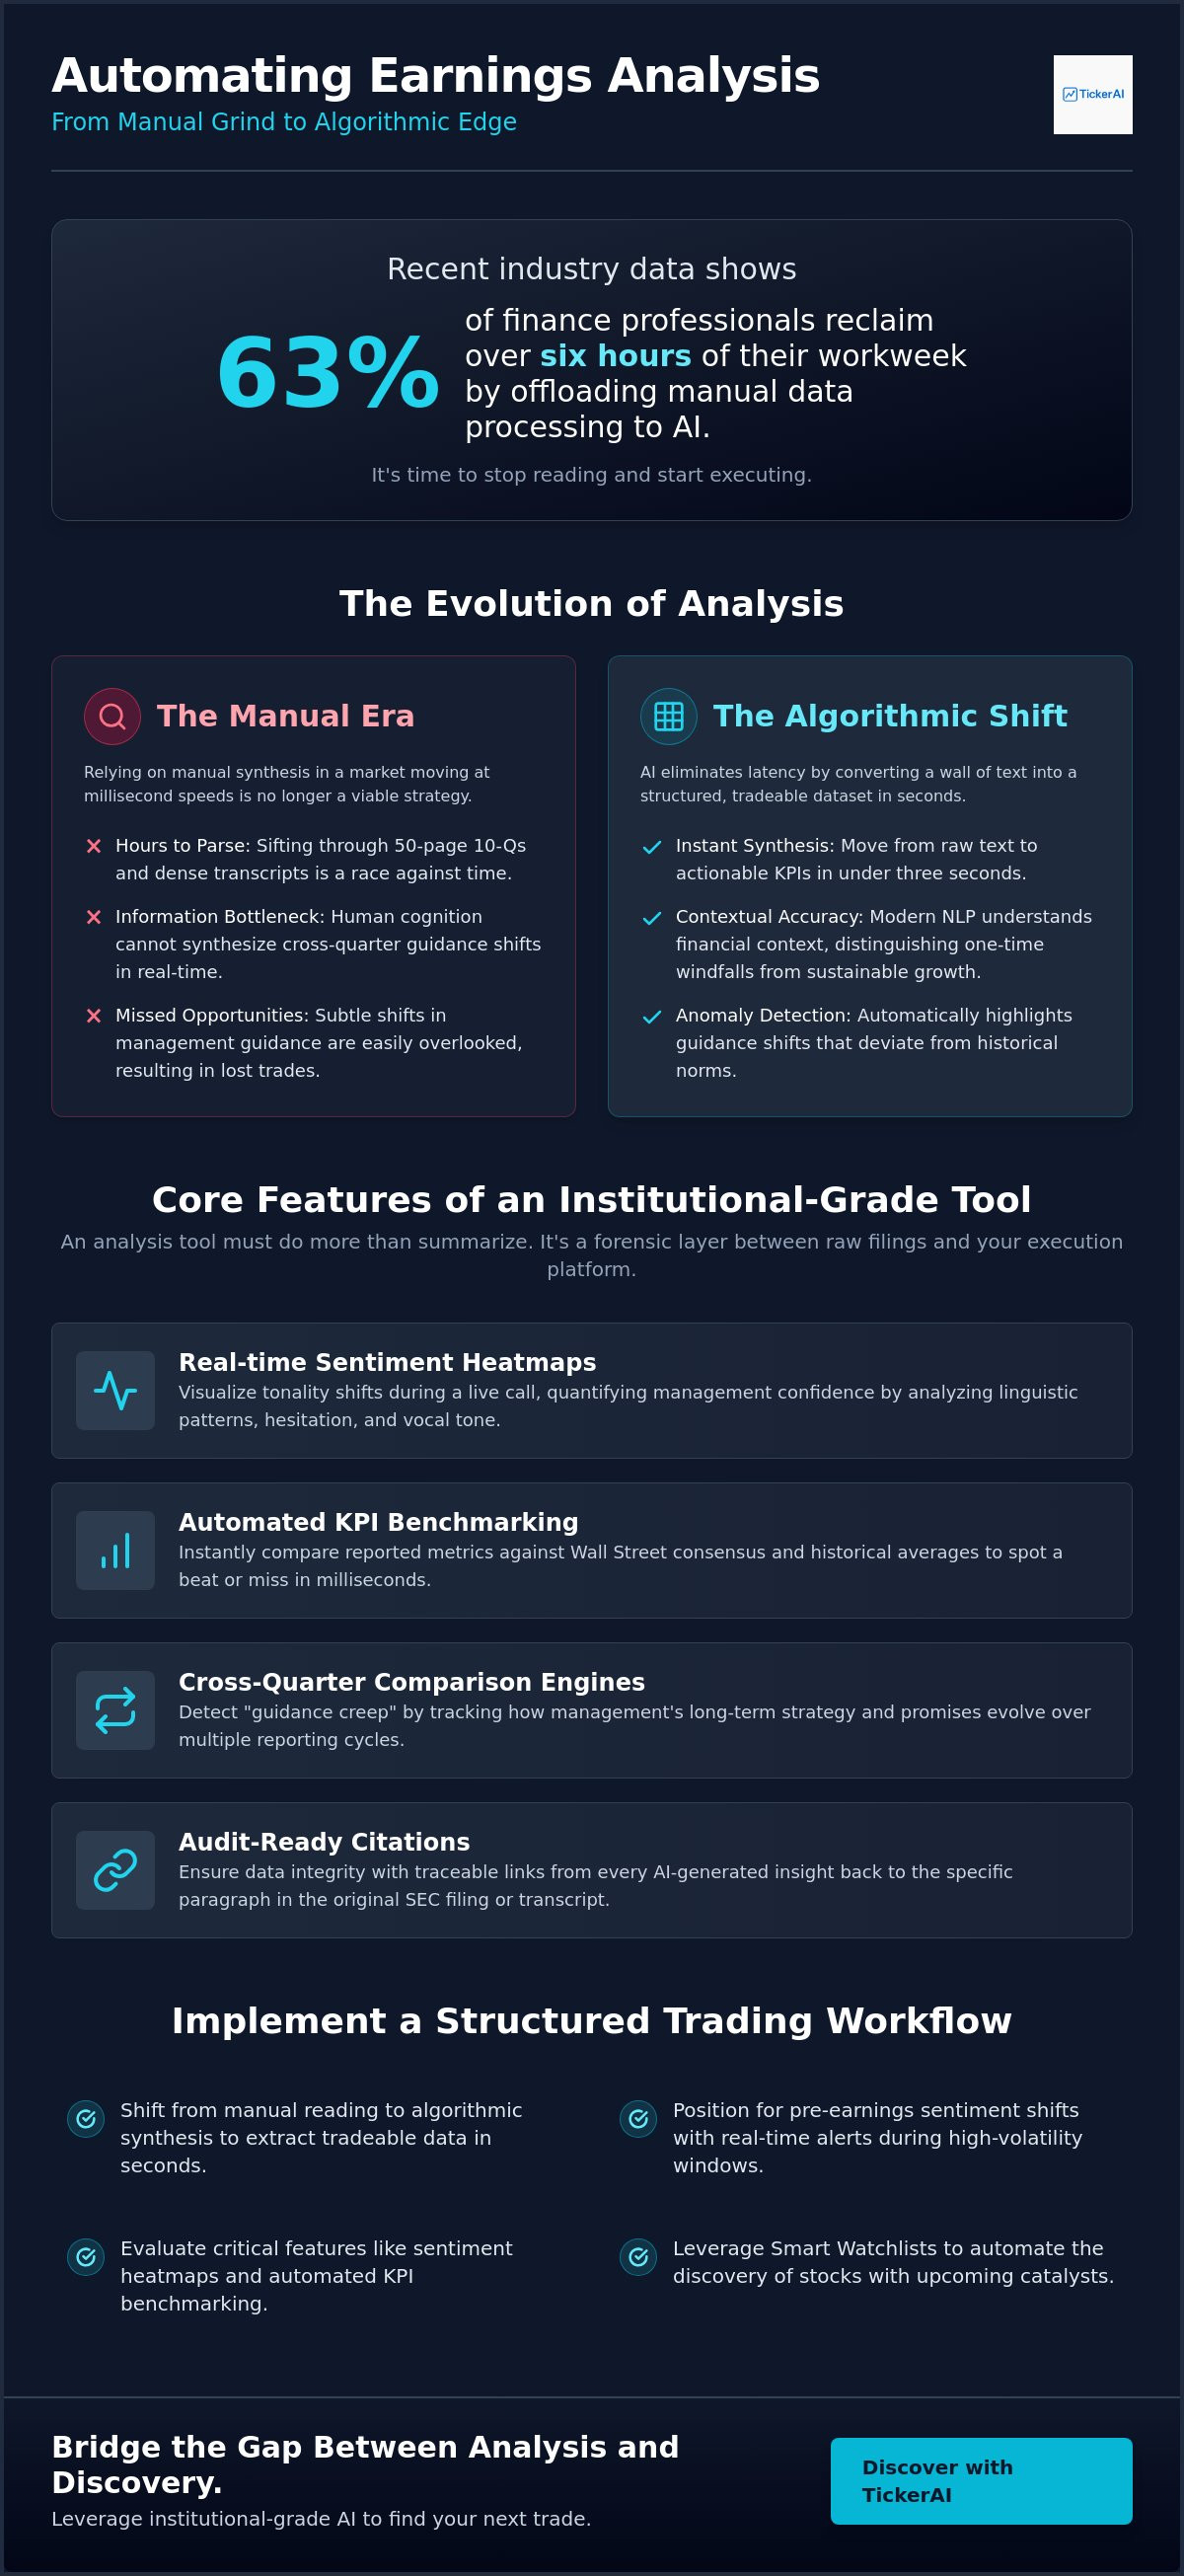
Recent industry data shows that 63% of finance professionals now reclaim over six hours of their workweek by offloading manual data processing to AI. You know the pressure of peak earnings weeks. It's a frantic race to parse transcripts before the window of opportunity closes. Missing a subtle shift in management guidance buried on page 40 of an SEC filing isn't just an oversight; it's a lost trade. Relying on manual synthesis in a market moving at millisecond speeds is no longer a viable strategy. Utilizing a professional automated earnings report analysis tool has shifted from a luxury to a technical necessity for those seeking a competitive edge.
You deserve an intelligence partner that works as hard as you do. We'll show you how to leverage institutional-grade AI to synthesize complex KPIs, detect sentiment shifts, and identify tradeable catalysts in seconds. This guide provides a roadmap for the 2026 landscape. You'll learn how to implement autonomous workflows that offer traceable citations back to original filings and immediate identification of market-moving anomalies. It's time to stop reading and start executing.
Key Takeaways
- Shift from manual reading to algorithmic synthesis to extract tradeable data from 50-page filings in seconds.
- Evaluate the critical features of a professional automated earnings report analysis tool, focusing on sentiment heatmaps and automated KPI benchmarking.
- Compare institutional-grade platforms against agile discovery tools based on latency, citation reliability, and integration depth.
- Implement a structured trading workflow to position for pre-earnings sentiment shifts and monitor real-time alerts during high-volatility release windows.
- Leverage Smart Watchlists to automate the discovery of stocks with upcoming catalysts, bridging the gap between raw analysis and execution.
The Evolution of Earnings Analysis: From Manual Reading to Algorithmic Synthesis
Automated earnings report analysis is the deployment of Natural Language Processing (NLP) and Large Language Models (LLMs) to ingest, parse, and interpret SEC filings and earnings transcripts. It represents a fundamental shift in how professionals interact with financial data. The manual era is dead. Reading a 50-page 10-Q or a dense transcript requires hours of focused attention. By the time a human analyst reaches the liquidity section, the market has already reacted. An automated earnings report analysis tool eliminates this latency by converting a wall of text into a structured, tradeable data set in seconds.
Manual analysis fails because it cannot scale. During peak earnings weeks, hundreds of companies report simultaneously. This creates a massive information bottleneck. Human cognition cannot synthesize cross-quarter guidance shifts across an entire sector in real time. This shift mirrors the broader adoption of algorithmic trading, where execution speed is paired with complex data ingestion. In 2026, the technology has moved beyond simple Optical Character Recognition (OCR). We have transitioned to semantic reasoning. Modern tools don't just recognize words; they understand the financial context and intent behind them.
Why Speed is No Longer the Only Metric
Basic LLMs have commoditized fast summaries. Anyone with a browser can generate a bulleted list of earnings highlights. This has led to rapid Alpha Decay, where the profit potential of a simple "beat or miss" headline vanishes in milliseconds. For the professional, "Contextual Accuracy" is the new benchmark. A professional automated earnings report analysis tool must distinguish between a one-time windfall and sustainable revenue growth. It identifies the "Thematic Friction" between what management says and what the balance sheet proves. If the summary is fast but lacks context, it's a liability, not an asset.
The Role of Natural Language Processing (NLP) in 2026
Modern NLP goes beyond keyword counting. It quantifies management confidence levels by analyzing linguistic patterns, hesitation markers, and vocal tonality in transcripts. It effectively extracts "Non-GAAP" metrics and specific segment data that traditional web scrapers often miss. These tools can flag when a CEO becomes defensive during a Q&A session, providing a sentiment score that acts as a leading indicator for price action. NLP in the context of earnings analysis is the algorithmic quantification of linguistic signals to transform management sentiment into objective, tradeable data points. This allows for a level of benchmarking that was previously impossible without a fleet of junior analysts.
- Instant Synthesis: Move from raw text to actionable KPIs in under three seconds.
- Sentiment Quantification: Convert management's tone into a numerical delta.
- Anomaly Detection: Highlight guidance shifts that deviate from historical norms.
Core Features of an Institutional-Grade Earnings Analysis Tool
An institutional-grade automated earnings report analysis tool must do more than summarize text. It acts as a forensic layer between raw SEC filings and your execution platform. In 2026, professional standards require absolute transparency and data integrity. High-speed summaries are useless without the ability to verify the source. Modern platforms prioritize traceable citations, linking every AI-generated insight directly to specific paragraphs in 10-Qs or transcripts. This allows for rapid verification during high-volatility windows, ensuring that your trade logic is grounded in documented fact rather than algorithmic hallucination.
Beyond simple extraction, these tools provide a competitive edge through multi-dimensional data synthesis. Key features include:
- Real-time Sentiment Heatmaps: Visualizing tonality shifts as they happen during a live call.
- Automated KPI Benchmarking: Instant comparison of reported metrics against Wall Street consensus and historical averages.
- Cross-Quarter Comparison Engines: Detecting "guidance creep" by tracking how management's long-term strategy evolves over multiple reporting cycles.
- Audit-Ready Citations: Direct links to SEC filings to satisfy 2026 regulatory supervision requirements.
To stay ahead of these shifts, many professionals integrate smart watchlist alerts to monitor ticker-specific anomalies the moment they hit the tape.
Sentiment Delta: Tracking Management Tone
The SERP gap in most retail tools is the lack of sentiment trajectory. A "positive" tone is often misleading. If a CEO's confidence score is positive but 20% lower than the previous four quarters, it's a bearish signal. This is Sentiment Delta. It measures the rate of change in management's linguistic conviction. Professional tools also flag "dodged questions." If an executive pivots from a direct inquiry about margin compression to a generic statement about "operational excellence," the AI flags the evasion as a risk factor. This observation-to-action flow allows you to price in management hesitation before the broader market digests the transcript.
Guidance Synthesis and Variance Detection
Identifying the gap between company guidance and analyst models is where alpha is found. An automated earnings report analysis tool synthesizes these disparate data points to highlight "Hidden Catalysts" buried in footnotes or minor segment reports. These catalysts often precede major price corrections or breakouts. For those focused on event-driven strategies, leveraging AI for tracking stock catalyst events ensures that no subtle guidance shift goes unnoticed. By automating the detection of variance between internal guidance and external expectations, you can position your portfolio for the inevitable re-rating that follows a guidance surprise.
Evaluating the Best Automated Earnings Tools in 2026
Selecting an automated earnings report analysis tool in 2026 requires a cold calculation of utility versus overhead. The market has bifurcated. On one side sit the "Heavyweight" institutional stacks designed for enterprise-wide compliance and deep forensic accounting. On the other are "Agile" discovery tools built for rapid execution and swing trade positioning. For the professional trader, the choice isn't about which tool has the most features. It's about which tool has the lowest friction between data ingestion and trade execution. If the platform creates a bottleneck, it's not a solution.
Evaluation criteria must be rigorous. Professional workflows demand three core benchmarks:
- Latency: Sub-second processing is the baseline. If the summary arrives after the initial price spike, the alpha has already decayed.
- Citation Reliability: The AI must prove its claims. Every KPI must link to a specific line in the 10-Q or 10-K filing to satisfy internal risk controls.
- Integration Depth: The tool shouldn't live in a vacuum. It must feed directly into your existing ecosystem, from execution terminals to smart watchlists.
The cost-to-value ratio is a critical differentiator for prosumer traders. While enterprise seats for top-tier platforms can range from $10,000 to $20,000 annually, agile alternatives now provide institutional-grade sentiment analysis at a fraction of that overhead. Mobile-first alerts are no longer a luxury. Volatility is constant. You need to know about a guidance shift the moment it hits the tape, regardless of whether you're at your desk or in transit.
AlphaSense vs. Aiera vs. Researchly: A 2026 Perspective
AlphaSense remains the "Search Engine" for global corporate data. It's the primary choice for deep historical dives and cross-document searching across millions of filings. Aiera has secured its position as the "Live Stream" specialist. Its infrastructure is built for real-time call monitoring and instant transcription with low-latency sentiment overlays. Researchly positions itself as the "Practical" choice for quick synthesis. It's designed for high-level benchmarking, making it ideal for analysts who need to cover broad sectors without getting bogged down in the forensic minutiae required by hedge fund auditors.
The Rise of "Agentic" Financial Research
We've moved beyond static tools. The 2026 market belongs to AI Agents. These are autonomous research partners that perform multi-step diligence without constant human prompts. They don't just summarize a report; they cross-reference it with sector peers, analyze historical guidance accuracy, and flag linguistic anomalies. This level of automated stock market analysis scales individual intelligence by allowing a single trader to monitor hundreds of concurrent earnings releases without cognitive fatigue. The transition from "assisted" to "agentic" research is the final step in eliminating the human bottleneck in financial analysis. You focus on the decision; the agent handles the discovery.
Integrating Automated Analysis into Your Trading Workflow
Execution is where research becomes profit. For the active participant, an automated earnings report analysis tool isn't just a reading assistant; it's a front-office execution framework. While institutional back-offices focus on archival efficiency, traders require a systematic workflow that moves from data ingestion to order entry without hesitation. High-frequency environments demand a four-step integration process to ensure no catalyst is ignored and no "fake-out" is chased.
- Step 1: Pre-Earnings Positioning. Utilize historical sentiment deltas to identify stocks where management conviction has been trending upward. This provides a baseline of expectation before the first headline hits the tape.
- Step 2: Real-Time Alert Monitoring. During the release window, your tool must scan for high-variance anomalies. You're looking for the gap between the expected KPI and the actual reported figure, synthesized in milliseconds.
- Step 3: Technical Validation. Validate a price breakout by cross-referencing it with AI-synthesized fundamental data. If the price spikes but the sentiment score is neutral, the move may lack the structural support needed for a sustained trend.
- Step 4: Post-Earnings Drift. Capture the "Post-Earnings Announcement Drift" (PEAD). Use automated summaries to identify significant guidance upgrades that suggest multi-day momentum rather than a single-session pop.
To begin systematizing these steps, you can access TickerAI's Smart Watchlist and Alerts to monitor these shifts in real time.
Combining Fundamental Beats with Technical Momentum
An earnings beat is meaningless if the tape doesn't confirm it. Markets often "sell the news" even on positive results if the guidance fails to exceed heightened expectations. Professional traders use algorithmic filters to separate noise from signal. Learning how to interpret AI stock signals is critical here. It allows you to filter out "fake-out" moves by ensuring the technical momentum is backed by a verifiable fundamental catalyst. Setting smart watchlists based on specific earnings "surprises" ensures you're only alerted to setups with a high probability of follow-through.
Eliminating FOMO through Rule-Based Discovery
Emotional "chasing" of green candles is the primary cause of slippage during earnings season. An automated earnings report analysis tool provides an objective "Cooling Period" analysis. By presenting a clinical summary of the report's strengths and weaknesses within seconds, the AI prevents the reflexive urge to buy into a spike without context. It enforces a rule-based approach. You wait for the synthesis, verify the citation, and then execute. This systematic research builds long-term confidence. It transforms a chaotic earnings week into a series of calculated, data-driven decisions. High-speed intelligence doesn't just save time; it preserves capital by removing the human propensity for panic.
TickerAI: Bridging the Gap Between Analysis and Discovery
TickerAI functions as the essential discovery layer sitting atop the mountain of seasonal earnings data. It doesn’t just synthesize; it prioritizes. While a standard automated earnings report analysis tool provides the "what," TickerAI provides the "so what." It identifies the specific catalysts that move price. This is the fundamental difference between having a map and having a scout. TickerAI acts as your proactive scout in a chaotic market, filtering through thousands of data points to find the handful of trade setups that actually matter.
The platform is designed to eliminate the cognitive load of monitoring a global portfolio. Most research tools require you to know what you’re looking for before you start. TickerAI flips this logic. It scans the tape for anomalies you haven't even considered. By positioning the technology as a discovery engine rather than a passive archive, it moves you from a reactive state to a proactive one. You aren't just reading the news; you're anticipating the market's response.
Smart Watchlists and Real-Time Earnings Alerts
TickerAI monitors thematic shifts across entire sectors during the peak of earnings season. It detects when a single company’s guidance hike signals a broader industry re-rating. By integrating AI for market trend analysis with specific earnings outcomes, TickerAI connects micro-events to macro trends. You can customize alerts for specific triggers like "Guidance Hikes" or "Margin Expansion" within high-momentum sectors. This ensures you’re never late to a sector-wide rotation. The system tracks these catalysts automatically, ensuring your watchlists are always populated with stocks that have verifiable fundamental backing.
The platform offers two primary tiers of intelligence to match your research intensity. The TickerAI Pro Subscription is built for the active swing trader who needs high-speed alerts and advanced filtering. For institutional-grade participants or those requiring unrestricted access to the entire intelligence stack, the TickerAI Full-Access Subscription provides the deepest level of forensic data and historical sentiment benchmarking. Both tiers are designed to deliver a technical edge that was previously reserved for bulge-bracket hedge funds.
Securing Your 2026 Trading Edge
Automation isn’t about replacing the trader. It’s about magnifying their edge. In the 2026 market, the "Observation-to-Action" workflow is the only metric that determines profitability. You observe the anomaly; the AI validates the fundamental logic; you execute the trade. This clinical precision removes the emotional friction that leads to costly errors. If you're still manually parsing transcripts, you're competing with machines that have already finished the job. It's time to leverage institutional-grade technology for your personal portfolio. Secure your position in the fast-moving market by starting your TickerAI Pro Subscription today. The edge belongs to those who act on intelligence, not just information.
Command the 2026 Earnings Cycle
The 2026 market doesn't reward those who read faster; it rewards those who synthesize better. Manual transcript parsing is now a relic of a slower era. You've seen how a professional automated earnings report analysis tool transforms dense filings into tradeable sentiment deltas and verified KPIs in seconds. By shifting from passive search to proactive discovery, you eliminate the cognitive bottlenecks that lead to missed entries and emotional chasing. Success now depends on your ability to validate technical momentum with institutional-grade fundamental signals. This isn't just about saving time. It's about maintaining a clinical edge when volatility peaks.
It's time to stop reacting to the tape and start anticipating the re-rating. You can now bridge the gap between raw data and profitable execution. Access Institutional-Grade Discovery with TickerAI Full-Access to leverage real-time AI-driven stock discovery, curated swing trade setups, and Smart Watchlists tailored for 2026 market themes. Precision is your primary advantage in a high-frequency environment. The tools are ready. The data is live. Your next trade is waiting for confirmation. Step into the future of algorithmic alpha today.
Frequently Asked Questions
What is the best automated earnings report analysis tool for individual traders in 2026?
The best tool depends on your specific workflow. TickerAI is the preferred choice for active traders who prioritize discovery and real-time swing trade setups. While institutional platforms like AlphaSense offer deep archival search for forensic analysts, TickerAI provides the high-speed alerting and catalyst detection necessary for capturing alpha during volatile earnings windows.
How accurate are AI-generated earnings call summaries?
AI-generated summaries in 2026 are highly accurate when built on retrieval-augmented generation (RAG) frameworks. These systems don't just summarize; they verify. Professional-grade tools now provide direct, clickable citations back to the original SEC filings. This ensures the synthesis reflects the actual management commentary rather than an algorithmic guess or hallucination.
Can an automated earnings tool predict stock price movement?
No tool can predict price with absolute certainty, but an automated earnings report analysis tool identifies the catalysts that drive that movement. By detecting sentiment shifts or guidance variances before the broader market reacts, you can position your portfolio based on the probability of a re-rating. It transforms speculation into a data-driven calculation of risk and reward.
What is the difference between sentiment analysis and KPI extraction?
Sentiment analysis measures management's linguistic conviction and tone, while KPI extraction focuses on hard numerical data. Sentiment provides the context behind the numbers. For instance, a revenue beat might be overshadowed by a defensive tone during the Q&A session. This signals underlying operational risks that a purely numerical analysis would likely miss.
Do I need a Bloomberg Terminal to get institutional-grade earnings analysis?
You don't need a Bloomberg Terminal to access institutional-grade insights in 2026. Modern AI-driven platforms provide similar sentiment scoring and forensic data at a significantly lower overhead. These tools have democratized access to the same algorithmic discovery layers used by bulge-bracket hedge funds, allowing retail-plus participants to compete on a level playing field.
How do AI tools handle non-GAAP financial metrics in SEC filings?
Modern LLMs excel at identifying and extracting non-GAAP metrics that traditional data scrapers often ignore. They can parse complex footnotes to find adjusted EBITDA or segment-specific free cash flow figures. This ensures you're seeing the same adjusted metrics that institutional analysts use to build their valuation models and price targets.
Is it possible to integrate earnings analysis tools with my brokerage account?
Integration is standard in 2026 through secure API layers. Most professional tools allow you to sync your smart watchlists directly with your execution platform for immediate order entry. This seamless flow from discovery to execution is critical for capturing momentum in a market where alpha decays in a matter of seconds.
What should I look for in an earnings analysis tool to avoid AI hallucinations?
To avoid hallucinations, prioritize an automated earnings report analysis tool that offers audit-ready citations for every data point. A reliable system will never present a KPI or a guidance shift without a direct link to the source paragraph in the filing. Avoid "black box" systems that provide summaries without a verifiable trail back to the SEC documentation.