

Price can narrow a stock universe, but it can’t tell you whether a company fits your strategy. To learn how to build a stock screening strategy, combine a price range with market-capitalization and industry filters, then add financial or technical criteria that match your goal. If you want to exclude stocks priced above $100, set that as a ceiling; use market cap to distinguish company size and industry to keep comparisons relevant.
Screeners help sort a crowded market, but overly narrow criteria can hide candidates, while loose filters may return more stocks than you can assess. The goal is a focused, repeatable shortlist, not a screen that makes decisions for you.
You’ll learn how to choose and adjust criteria, compare prebuilt screeners, and test results against benchmarks. The article also covers building screens around price, company size, and industry, then using AI assistance to create custom filters and refine your process.
Key Takeaways
- Start with a prebuilt screen, then adjust its filters to match your investing goal and keep the candidate list manageable.
- Compare screeners by their available criteria and data, then assess results against a relevant benchmark before relying on a strategy.
- Use plain-language AI prompts to translate an investment idea into screening criteria, then review the logic and resulting candidates.
- Combine price, market capitalization, and industry filters to define a focused stock universe without treating screening results as a final decision.
Using prebuilt screeners and modifying their criteria
Prebuilt screeners offer a starting point, not a finished strategy. Use their filters to create an initial shortlist, then adjust the rules to fit your objective. When considering how to build a stock screening strategy, make every filter serve a specific part of your investment thesis.
Selecting Fundamental and Quantitative Criteria
Fundamental criteria assess company finances, while quantitative criteria apply numerical rules to financial or market data. Both help identify stocks that match a defined thesis. For example, a value screen might require a price-to-earnings ratio below 25, earnings-per-share growth above 10% over the last five years, and a debt-to-equity ratio above 0.1. Choose measures that fit your rationale. Avoid combining filters simply because they appear in the screener.
Aligning Screens With Investment Goals
Your investment goal, time horizon, and risk tolerance determine which criteria belong in a screen. A long-term growth approach may prioritize sustained earnings trends, while a value approach may emphasize valuation and financial strength. Decide how much volatility you can tolerate, then choose filters that reflect that preference. This alignment keeps your screening rules relevant to your intended holding period and the risks you’re willing to accept.
Combining Criteria to Maintain a Broad Universe
Apply filters for clear reasons, and watch how each one changes the candidate list. In a value-screening example, three additional criteria narrow the candidate list to five stocks. If the result becomes too restrictive, loosen one threshold at a time and compare the new output. For liquidity, consider average trading volume of at least 200,000 shares a day when trading activity matters to your approach.
Modifying Prebuilt Screener Criteria
To build a stock screening strategy around a prebuilt tool, revise mismatched filters, adjust thresholds, and rank results by relevant measures. Keep a valuation rule but remove a growth condition if it conflicts with a value-focused thesis. Prioritize core criteria and use secondary measures to sort candidates. Then examine companies individually: a screener organizes research, but it doesn’t make investment decisions.
Comparing screeners and validating performance against benchmarks
Compare screeners by their available fields, market coverage, customization options, and data update practices. One platform may offer detailed financial ratios; another may provide stronger technical filters or easier sorting. Apply the same criteria in each tool, then compare the candidate lists. Differences can reveal how definitions, data sources, or missing company records affect results.
Test a screen against a benchmark that reflects its investment universe, such as a broad-market index for a diversified stock screen. Use the same evaluation period and assumptions for both. Compare total returns alongside volatility, drawdowns, and turnover. A screen that beats its benchmark on returns may still involve deeper losses or more frequent trading. Check how results vary across market conditions instead of relying on one favorable period.
Review criteria on a consistent schedule and revisit them when your goals, market assumptions, or company fundamentals change. Compare the current shortlist with earlier results to see which filters repeatedly remove relevant candidates. Adjust the screen when its logic no longer matches your strategy, not merely because its output changes.
Screening results have limits. Data may be stale, incomplete, or defined differently across platforms, so a company may qualify under one screener and fail another. A historical test can also mislead if it excludes companies that later disappeared or uses information unavailable at the time. Inspect the underlying figures and check that the screen’s rules were applied consistently.
For an additional source of candidates, explore AI-powered stock opportunity discovery alongside your benchmark process. Treat generated ideas as inputs for further analysis, not as proof that a screen will outperform.
Creating custom screeners with plain-language AI assistance
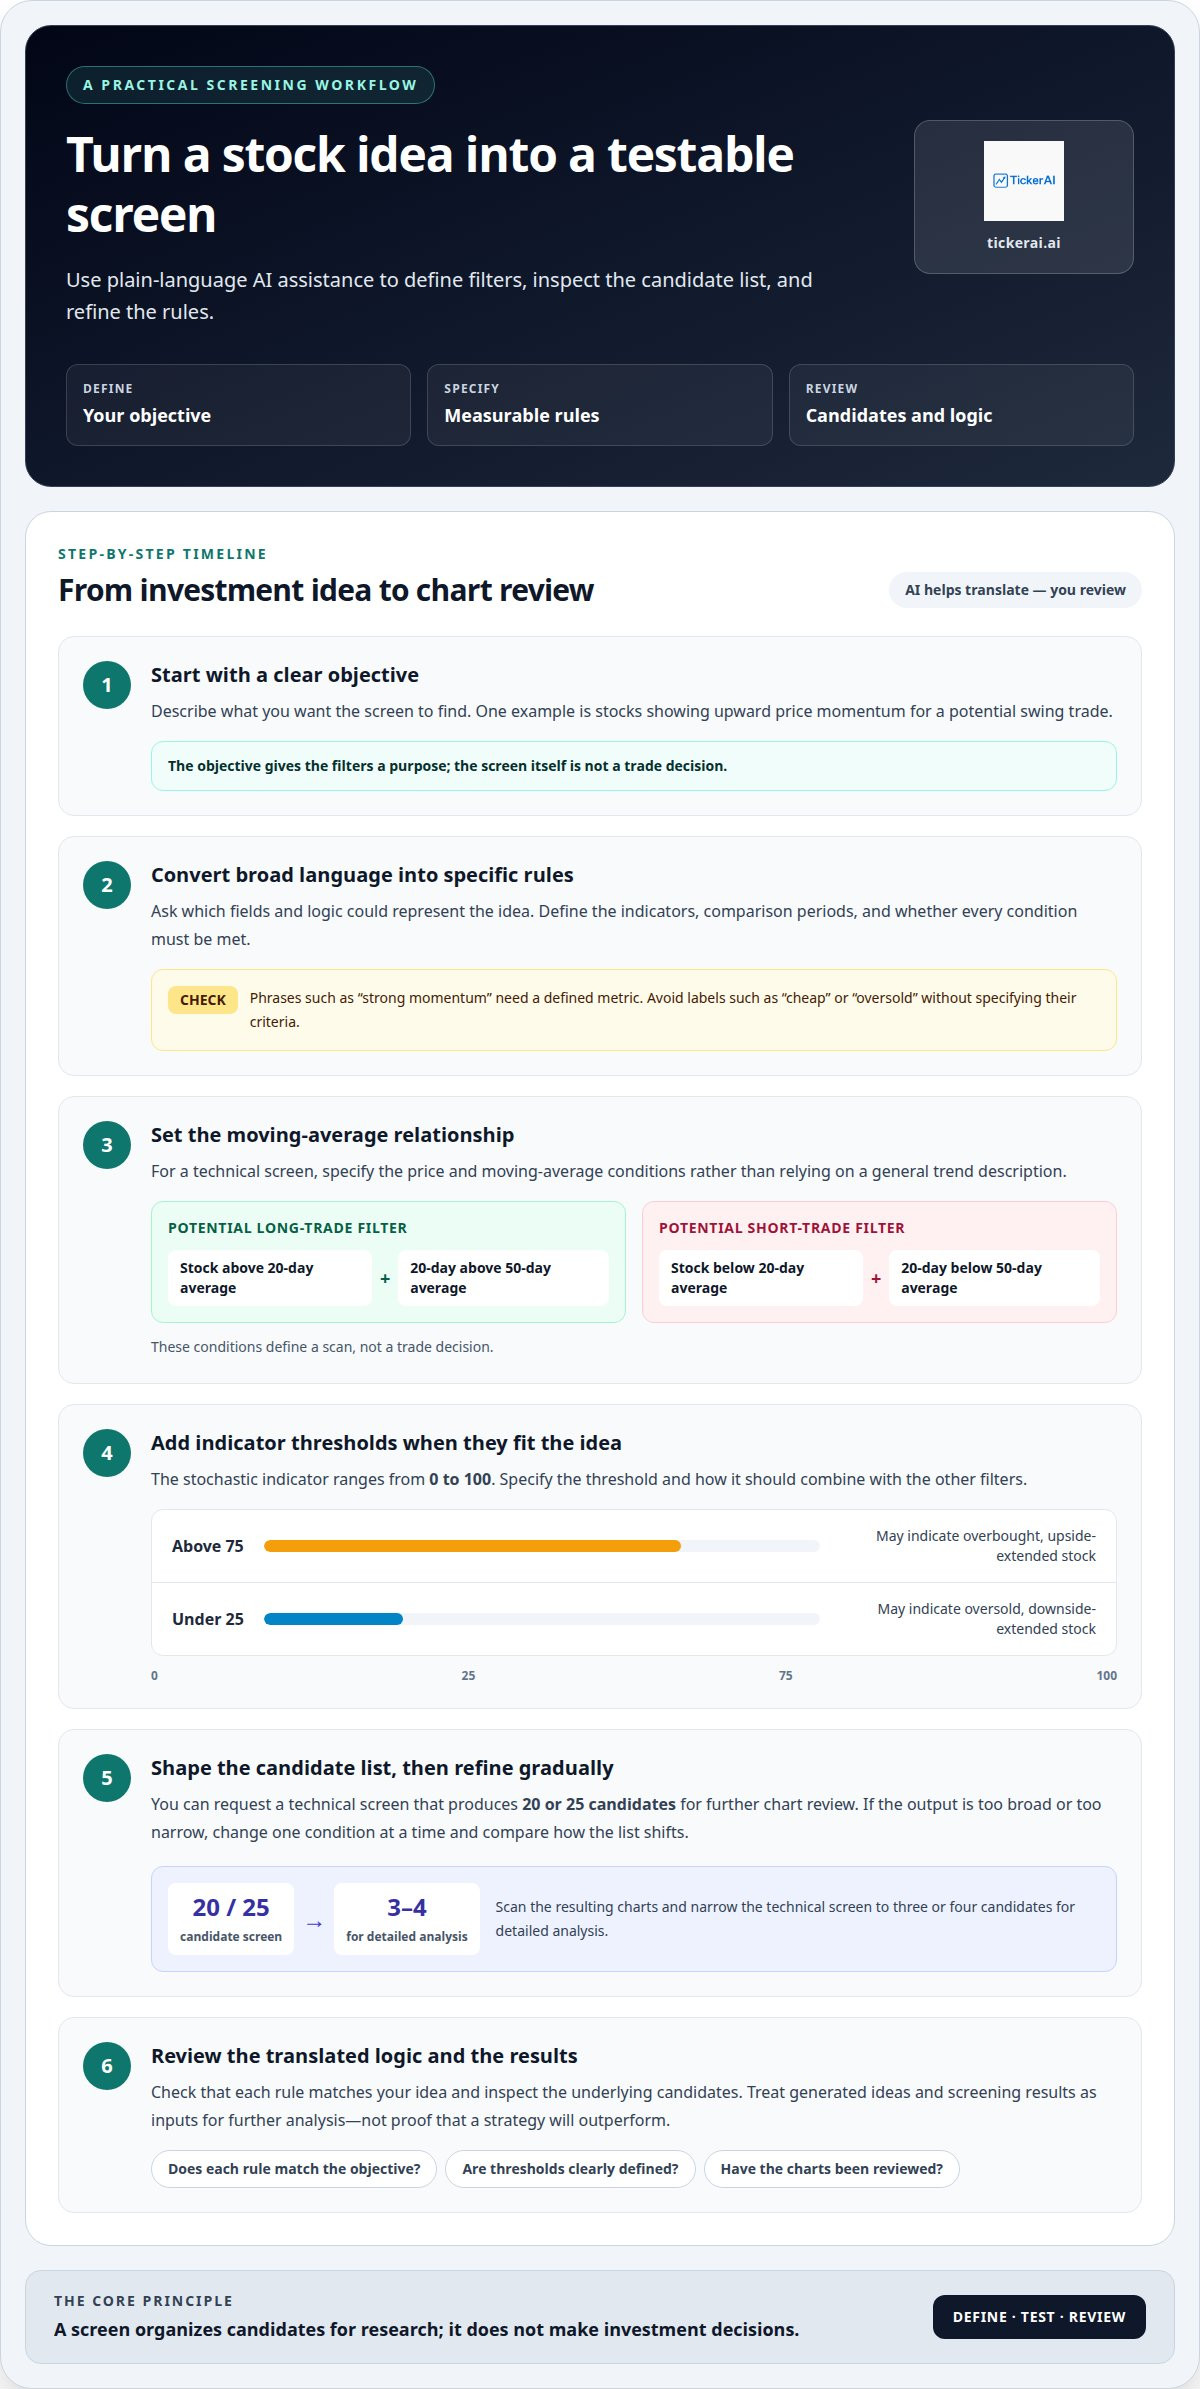
Plain-language AI assistance can translate an investing idea into measurable screening rules. Start with a clear objective, then ask which fields and logic could represent it. For example, a prompt might describe stocks showing upward price momentum for a potential swing trade. The resulting rules should specify the indicators, comparison periods, and whether all conditions must be met. Review each translation before using it: broad phrases such as “strong momentum” need a defined metric.
For a technical screen, request criteria that produce 20 or 25 stock candidates for further chart review. A prompt can specify a stock above its 20-day moving average, with that average above its 50-day moving average, as a potential long-trade filter. For a potential short-trade screen, reverse the relationship: price below its 20-day average, with that average below its 50-day average. These conditions define a scan, not a trade decision.
AI can also help express indicator thresholds. The stochastic indicator ranges from 0 to 100; a reading above 75 may indicate an overbought, upside-extended stock, while a reading under 25 may indicate an oversold, downside-extended stock. Ask the system to include the selected threshold and explain how it combines with other filters. Avoid prompts that request “cheap” or “oversold” stocks without specifying the criteria behind those labels.
Refine the screen if its output is too broad or too narrow. Change one condition at a time, then compare how the candidate list shifts. Scan the resulting charts and narrow the technical screen to three or four candidates for detailed analysis. If the strategy targets swing trades, remember that traders may hold stocks for a few days to a few weeks. That horizon can guide which technical signals matter, while chart review helps assess whether the screen’s rules fit the setup.
Screening stocks by price, market capitalization, and industry
Price, market capitalization, and industry describe different dimensions of a stock universe. Share price is the cost of one share, not a measure of a company’s total size. Market capitalization reflects the market value of a company’s outstanding shares. Industry filters group businesses with related activities, making comparisons more relevant. Use each filter for its intended purpose rather than treating them as interchangeable.
Set a price range only when share price matters to your strategy or trading constraints. For example, a technical screen can exclude stocks priced above $100 if you want to avoid stocks over that level. This filter changes which stocks appear, but it doesn’t identify cheaper companies by valuation. A high-priced share can belong to a company with a different overall market value than a lower-priced share.
Use market capitalization to focus on company size. A screen limited to larger companies produces a different universe from one that includes smaller companies. Then select industries relevant to your analysis. Comparing businesses within the same industry can make financial measures easier to interpret because they may face similar market conditions. For example, comparing one retailer with another is usually more informative than comparing a retailer directly with a software company.
Apply filters in sequence: define the market-cap range, select industries, then set a price boundary if it serves a clear purpose. Check how each filter changes the candidate list. If an industry choice removes companies central to your thesis, broaden the filter. If a price cap excludes relevant stocks, remove or revise it. Tie each criterion to a decision instead of using filters simply because a screener offers them.
To pair these filters with a wider search for candidates, explore AI stock opportunity discovery as another input to your screening process.
TickerAI: AI Stock Opportunity Discovery
TickerAI’s AI Stock Opportunity Discovery can help surface market opportunities once you’ve defined your screening criteria. Use it to find additional ideas to assess alongside your own filters, rather than relying on a screen alone. The platform also offers Swing Trade Setups, Smart Watchlist & Alerts, and Long-Term Investment Ideas to support different approaches to monitoring and researching stocks.
Use these tools as inputs to your process: compare ideas with your objectives, examine the underlying signals, and decide whether they merit further analysis. A generated opportunity is a starting point, not a substitute for your own evaluation.
For details on using these offerings in your investing research, contact TickerAI.
Make Your Screening Process Adaptable
The next step in building a stock screening strategy is to treat each filter as a testable part of your investment thesis. As that thesis changes, review whether the criteria still capture the companies and signals you intend to find. Keep the logic clear enough to explain why a stock qualifies, and revise it when the underlying reason no longer holds.
That discipline separates a useful process from a collection of filters that merely produces results. Use screening to organize research, then make decisions with context and independent judgment. A strong framework is one you can understand, evaluate, and adjust without losing sight of your goal.
Ready to add AI-powered discovery to your research workflow? Explore stock-screening support with TickerAI and keep building a process that fits your approach.
Frequently Asked Questions
What is a stock screening strategy and how does it work?
A stock screening strategy applies consistent rules to market data to identify stocks for further research. You define the characteristics you want, such as financial strength or price behavior, and a screener filters its coverage accordingly. The output is a research shortlist, not a buy or sell decision. For example, an investor can apply the same rules repeatedly and track whether changes produce candidates that better fit the original thesis.
Which fundamental metrics are commonly used to screen stocks, and what thresholds are reasonable?
Common fundamental metrics include valuation ratios, revenue or earnings growth, profitability, debt levels, and cash flow. No single threshold suits every company: an appropriate cutoff depends on the industry, accounting context, and investment thesis. Compare firms with relevant peers, and consider whether a range captures your intent better than a rigid pass-or-fail limit. Keep the rationale for each cutoff clear so you can judge whether it remains useful.
Which technical indicators and price rules can be used in a stock screener?
Technical screens can combine price trends, moving averages, trading volume, and momentum indicators such as the stochastic oscillator. A useful rule might flag stocks whose price action and volume both support a developing trend. Treat each signal as a condition to investigate, not confirmation on its own. Indicators can describe different aspects of market behavior, so avoid stacking several that measure nearly identical momentum signals.
How can you backtest a stock screening strategy and avoid survivorship bias and overfitting?
Backtest by applying the screen to historical data as it would have appeared at each review date, including companies that later left the market. This reduces survivorship bias caused by testing only current stocks. To limit overfitting, define the logic before testing, reserve separate data for evaluation, and avoid repeatedly tuning filters against the same period. Record every rule change so the final test reflects a stable method.
How do you compare stock screening strategies by returns, volatility, drawdowns, and transaction costs?
Compare each strategy over the same dates and against the same benchmark, then assess returns alongside volatility and maximum drawdown. Estimate how trading frequency affects transaction costs, including spreads, commissions, and slippage where applicable. A strategy with higher gross returns may deliver weaker net results after trading expenses. Also check whether performance depends on a small group of stocks or a narrow market phase.
How do you build a stock screen using free tools such as Finviz or a brokerage screener?
Start with a prebuilt screener, then adjust its criteria to match your investment goal. Combine market-cap and industry filters with a price limit only if it serves a clear purpose, and add relevant financial or technical rules. Review candidates individually and loosen filters one at a time if the list is too narrow.


