

More chart detail can mean less clarity. To learn how to filter out market noise, use chart tools that reduce the emphasis on small price swings while keeping the broader direction visible. Moving averages, Heikin-Ashi candles, and the ZigZag indicator each smooth price action in a different way.
Short-term reversals and intraday volatility can distract from a developing trend or make routine pullbacks seem more significant than they are. A smoother chart can help you focus on larger moves, but it does not remove risk or guarantee a reliable signal.
This guide explains what market noise is and how these three tools can make price action easier to interpret. You’ll learn what each method highlights, where its limitations matter, and how the ZigZag indicator can help clarify significant price swings.
Key Takeaways
- Use the 5, 8, and 13 Simple Moving Average framework on a daily chart to visualize momentum, rather than reacting to every short-term move.
- Heiken Ashi candles average price data to smooth chart patterns, making trend direction easier to assess while changing how individual bars appear.
- Compare higher and lower timeframes to distinguish broader price direction from intraday fluctuations that may distract from the trend.
- Use ZigZag to highlight significant price swings and screen out smaller moves; TickerAI’s stock discovery, trade setups, watchlists, alerts, and investment ideas can help you identify opportunities to examine.
5, 8, And 13 Simple Moving Average strategy
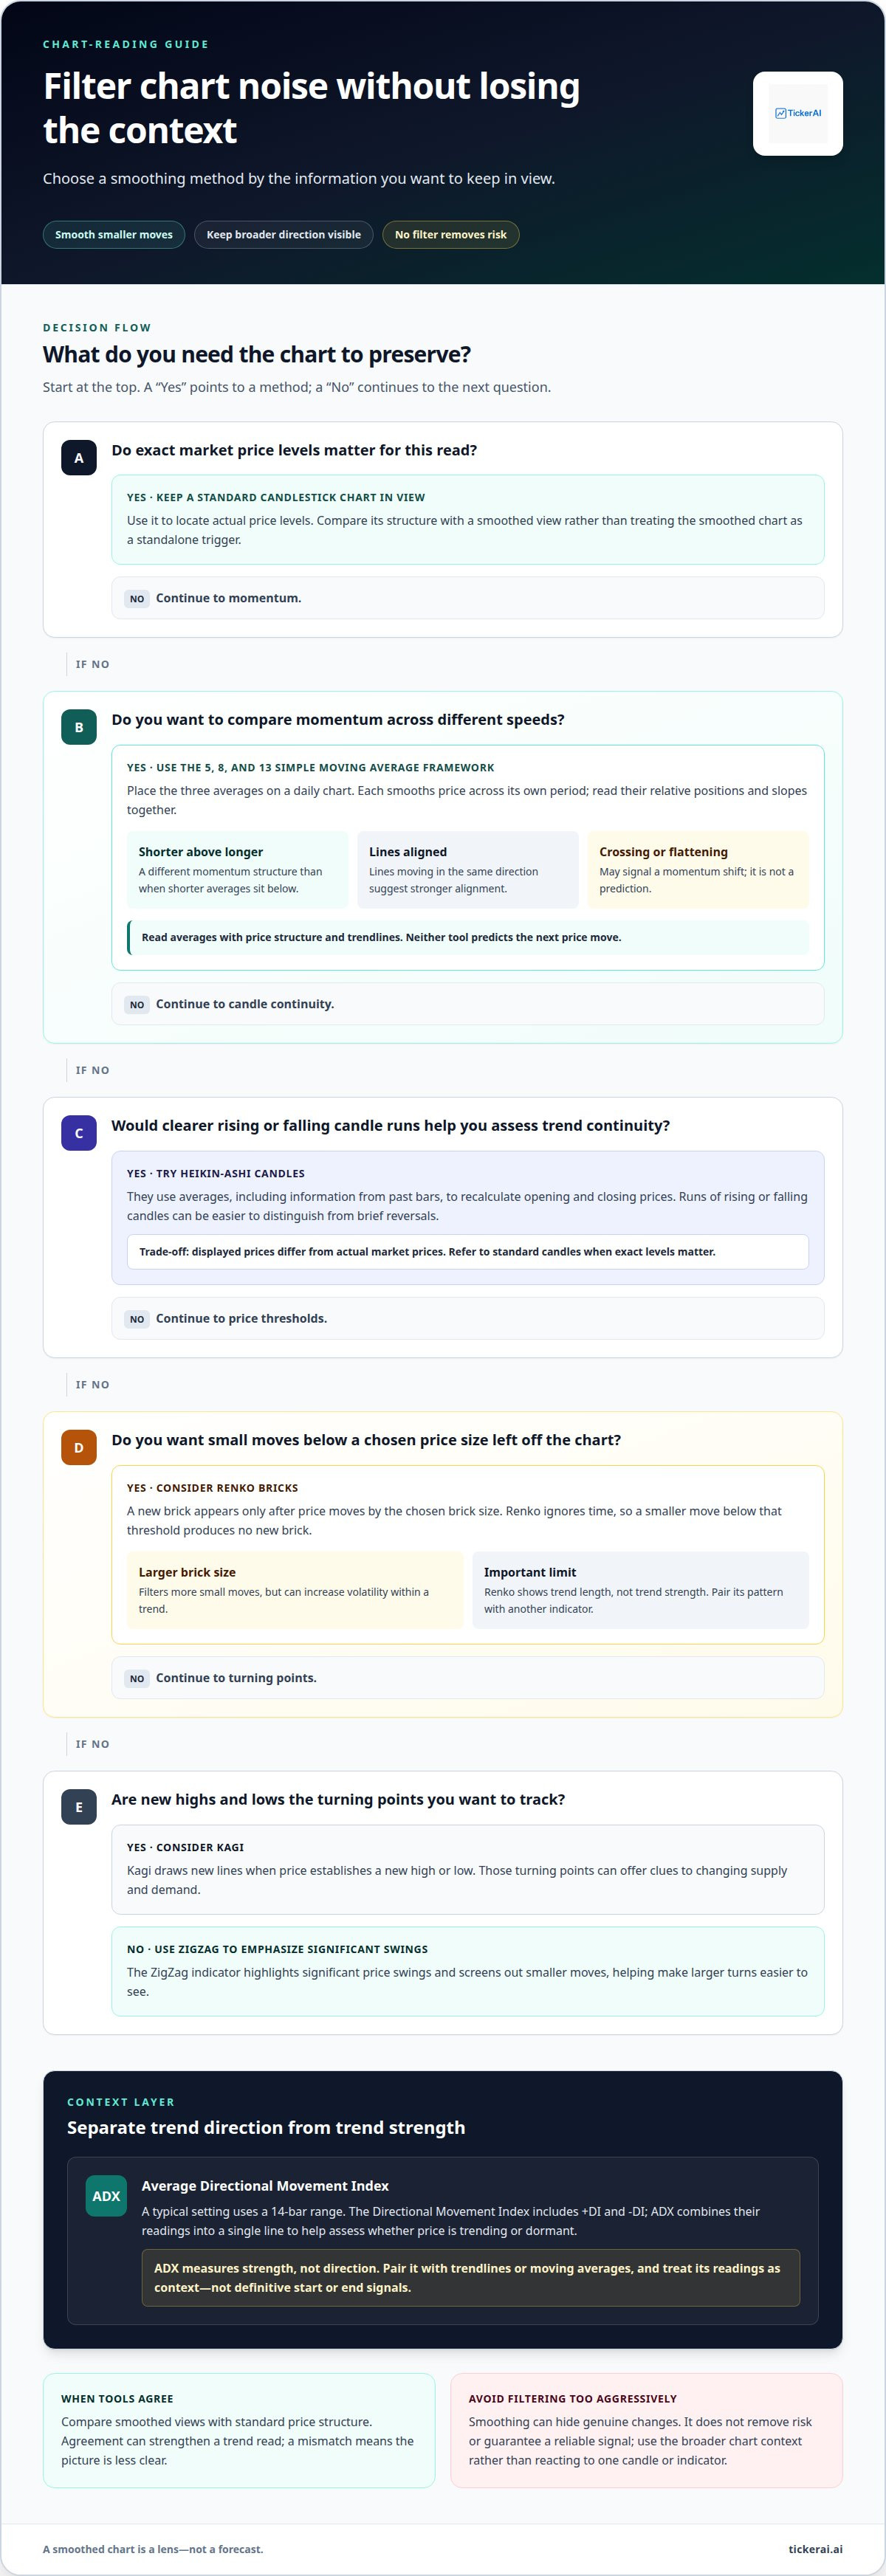
The 5, 8, and 13 Simple Moving Average framework places three moving averages on a daily chart to visualize momentum. Each line averages price across its own period, smoothing smaller fluctuations while keeping the broader direction visible. The different periods respond at different speeds, so their relationship can reveal whether momentum is strengthening or weakening.
Read moving averages together rather than treating any one line as a trade signal. When shorter-period averages sit above a longer-period average, they show a different momentum structure than when they sit below it. Their slopes add context: lines moving in the same direction suggest stronger alignment, while crossings or flattening may signal a momentum shift. This framework helps focus attention on price structure instead of every bar.
Moving averages work best alongside price structure. Draw trendlines across meaningful swing highs or lows, then compare their direction with the averages. If an upward trendline and rising averages point the same way, they provide converging evidence of an uptrend. If price breaks the trendline while the averages remain aligned, observe the difference rather than drawing an immediate conclusion. Neither tool predicts the next price move.
The average directional movement index, or ADX, adds a measure of trend strength. A typical setting uses a 14-bar range. The Directional Movement Index includes +DI and -DI, plotted to assess overall trend strength; ADX combines their readings into a single line that helps assess whether price is trending or dormant. ADX measures strength, not direction, so pair it with trendlines or moving averages.
ADX can provide context about trend strength, but its readings should not be treated as definitive signals that a trend is starting or ending. Treat these levels as context for the chart, not isolated entry instructions. Combining a direction-focused chart with a strength indicator can help filter out market noise and reduce false signals. For swing trade analysis, this layered view keeps short-lived price movement in perspective.
Heiken Ashi candles and chart smoothing
Heikin-Ashi candles, moving averages, Renko charts, and Kagi charts can help filter market noise by reducing the emphasis on smaller price changes. Each presents price differently, so compare its signals with the underlying chart instead of treating a smoothed view as a standalone trigger.
Heiken Ashi for Chart Smoothing
Heikin-Ashi candles use averages, including information from past bars, to recalculate opening and closing prices and smooth the chart. This makes runs of rising or falling candles easier to distinguish from brief reversals in a standard candlestick view. The trade-off is that displayed prices differ from actual market prices. Use these candles to assess trend continuity, then refer to standard candles when exact price levels matter.
Renko Bricks Based on Price
A Renko chart draws a new brick only after price moves by the chosen brick size, and it ignores time. A small move below that threshold produces no new brick, which removes some short-term fluctuations from view. Increasing brick size filters more small moves but can increase volatility within a trend. Because Renko shows trend length without measuring trend strength, pair its pattern with another indicator.
Tools for Filtering Market Noise
Moving averages smooth price by averaging values across selected periods, while Heikin-Ashi recalculates each bar and Renko waits for a price threshold. Kagi charts take another approach, drawing new lines when price establishes a new high or low. Traders can read these turning points as clues to changing supply and demand, while keeping in mind that each chart emphasizes different signals.
To combine chart types, use a standard candlestick chart to locate actual price levels, then compare its structure with a smoothed view. For example, a Heikin-Ashi sequence may show persistent direction while Renko suppresses smaller reversals. Agreement can strengthen a trend read; a mismatch signals that the picture is less clear. For broader market scans, explore AI-powered stock opportunity discovery.
What Is Market Noise?
Market noise is short-term price movement that can obscure a broader trend, such as a minor reversal during an advance. Stocks, forex, crypto, and futures all produce fluctuating price action, but the useful filter depends on the chart timeframe and trading strategy.
Market Noise and Underlying Trends
An underlying trend is the broader direction of price; noise is movement that distracts from it without changing that direction. For example, a pullback may interrupt a rising trend while the larger structure remains intact. Treating every reversal as a new signal can prompt unnecessary action. Filtering too aggressively creates the opposite risk: it can hide genuine changes. A filter fitted too closely to past price behavior may also become less useful when market conditions change.
Price Action and Market Structure
Price action is the movement visible on a chart, while market structure describes how successive highs and lows shape direction. A higher high followed by a higher low, for example, differs from a sequence of lower highs and lower lows. Use that structure to interpret signals instead of relying on a single candle.
In volatile conditions, set a stop-loss at a level that reflects the trade’s invalidation point, then size the position so the potential loss fits your risk plan. A wider stop generally calls for a smaller position to keep risk aligned. Do not choose the stop distance or position size simply to avoid being stopped out by ordinary fluctuations.
Higher Timeframes and Intraday Fluctuations
A higher timeframe compresses intraday movement into fewer chart bars. A 3 percent drop on a one-hour chart may look dramatic, yet appear as a routine retest on a daily chart. Daily charts can show fewer price movements than hourly charts, helping trend traders focus on the broader structure instead of reacting to every short-lived swing.
News-driven attention also needs context. A burst of discussion at 9:37 a.m. or a one-hour sentiment swing can distract without establishing a lasting market narrative. Assess whether coverage gains clarity, receives confirmation, and broadens across intervals before treating it as a meaningful signal. If intraday trading encourages reactive decisions, moving to higher timeframes and extending trade periods can reduce exposure to those fluctuations.
ZigZag indicator and significant price swings
The ZigZag indicator highlights significant price swings, leaving moves below its sensitivity threshold unmarked. Volume and volatility provide additional context: a price move accompanied by stronger trading activity or a clear expansion in volatility may deserve more attention than an isolated fluctuation. Neither filter confirms a trend on its own.
Think of ZigZag as a way to simplify a chart’s swing structure, not as a forecast. If price rises, pulls back, then advances again, the indicator connects the swings that meet its threshold and omits smaller fluctuations. This makes successive highs and lows easier to inspect. The threshold determines which movements appear: a setting that is too sensitive may retain distracting movement, while a less sensitive one can hide useful detail.
Use the display to answer a specific question: is price forming higher swing highs and higher swing lows, or are those turning points weakening? Compare the ZigZag path with the underlying price chart before interpreting a marked reversal. A line connecting past turning points describes a move that has already happened; it does not show that the next swing will continue in the same direction.
Volume and volatility can help distinguish a forceful move from random back-and-forth action. If a ZigZag swing coincides with rising volume or expanding volatility, that combination offers additional evidence to assess. If price moves while those measures remain muted, the move may deserve less emphasis. Interpret both in context: volume and volatility can change for different reasons, and neither replaces analysis of price structure.
For a practical read, first identify the ZigZag swing, then compare its direction with recent highs and lows and check volume or volatility for supporting context. This layered view can help keep attention on meaningful price movement without treating every plotted turn as a signal. To connect swing analysis with potential trades, explore Swing Trade Setups.
TickerAI
TickerAI helps turn market analysis into a focused stream of opportunities to review. Its AI Stock Opportunity Discovery, Smart Watchlist & Alerts, Swing Trade Setups, and Long-Term Investment Ideas can help you track potential market movements without treating every price fluctuation as a signal.
Use these tools alongside chart analysis. Moving averages, Heikin-Ashi candles, and ZigZag can clarify price structure; curated ideas and alerts can help surface opportunities for further consideration. TickerAI’s discovery tools suit traders and investors who want to organize market research around their preferred time horizon while keeping risk decisions their own.
For more information about how TickerAI can support your market research, contact TickerAI.
Make clearer analysis part of your routine
A useful next step is to make chart review part of a consistent decision process. Before acting, define what evidence would change your view, which timeframe supports the decision, and how much uncertainty you can accept. This gives each signal a role instead of letting every price move demand attention. Learning how to filter out market noise is less about removing every fluctuation and more about deciding which changes deserve a response.
Keep refining your process as market conditions shift. A filter that clarifies one chart can obscure useful movement in another, so judge tools by whether they support your analysis, not by how smooth the chart looks. Pair disciplined chart reading with a focused way to discover and monitor opportunities.
If you’re ready to connect your market research with your trading goals, contact TickerAI to discuss your trading goals. Keep your process deliberate, your signals in context, and your next decision grounded in evidence.
Frequently Asked Questions
What Are False Signals in Trading?
False signals are apparent trade cues that fail to develop as expected. A breakout above resistance, for example, may quickly reverse, returning price to its previous range. Reduce reliance on a single cue by checking whether price action, volume, and broader market structure support the same interpretation. A signal is evidence to assess, not a guaranteed outcome.
What does market noise mean in investing and trading?
Market noise refers to price changes that distract from information relevant to an investor’s or trader’s decision. A brief fluctuation may matter to a short-term strategy but have little bearing on a long-term investment thesis. Its relevance depends on the decision horizon and the asset’s context. The practical task is to separate movement that changes a plan from movement that merely attracts attention.
How can traders distinguish market noise from meaningful price signals?
Look for evidence that a move changes market structure or strengthens a developing market narrative, rather than reacting to one isolated candle or headline. For example, a price break that holds over subsequent bars has different context from a quick move that immediately reverses. Compare price behavior with your strategy’s timeframe and predefined conditions. Review signals that conflict with those conditions carefully.
How do moving averages and trend filters reduce market noise?
Moving averages combine price observations, so small fluctuations have less influence on the plotted line than on individual bars. A trend filter can help classify direction or strength before a strategy responds. The trade-off is lag: smoothing may delay recognition of a reversal. For example, a crossover may confirm a developing change only after price has already moved, so interpret it alongside chart structure.
What time frames help reduce noise in technical analysis?
The useful timeframe depends on how long you intend to hold a position. A longer chart compresses more short-term activity into each bar, while a shorter chart exposes fluctuations that may matter for execution. Keep analysis and decision horizons aligned: judging a long-term thesis by every intraday move can make it harder to follow. Use shorter views only when they serve a defined purpose.
How do noise filters compare across stocks, forex, crypto, and futures?
Stocks, forex, crypto, and futures all produce fluctuating price action. The useful filter depends on the chart timeframe and trading strategy; moving averages, Heikin-Ashi, and ZigZag each smooth or emphasize price movement differently.


