

Holding time can shape a swing trade as much as the entry. Swing trading aims to capture a price move over a short-term holding period, commonly 2-10 days, rather than closing every position the same day. Compounding returns with swing trading depends on more than stacking winning trades: overnight exposure, position size, and exit rules all affect how gains and losses build over time.
If you’re weighing swing trading against faster or longer-term approaches, its appeal is clear: trades can last long enough to follow a trend without requiring decisions throughout the trading day. But holding positions after the market closes exposes you to overnight and weekend price gaps. This article explains how swing trading works, how holding time affects risk, and why a stop-loss may not protect you fully from a sudden gap.
You’ll also see how trend-following signals, position sizing, and planned exits affect a strategy’s returns. The focus is practical: understand the mechanics of compounding, identify risks that can interrupt it, and consider how each trade fits into a larger plan.
Key Takeaways
- Understand how swing trading sits between day trading and position trading, and how your risk tolerance affects whether it fits your approach.
- Account for overnight and weekend exposure when deciding how long to hold a position; gaps can move prices beyond a planned stop-loss.
- Use trend signals, such as moving-average crossovers and pullbacks, to structure trade decisions rather than relying on a single indicator.
- Set position sizes and exit criteria before entering a trade to keep individual losses from dominating your overall results.
What is swing trading?
Swing trading aims to capture short-term price moves by holding positions beyond a single session. It sits between day trading and position trading, which can last weeks or months. Before entering, a trader analyzes price direction, sets a profit target, and defines an exit. Compounding returns with swing trading means reinvesting gains, but repeated trades also expose capital to repeated losses.
Start by considering your risk tolerance and available time. Can you hold through overnight news, follow a stop-loss, and accept a loss without increasing your next position? A risk-to-reward ratio compares the planned loss with the potential profit. Risk-adjusted returns matter more than headline gains: assess profits against the capital exposed and any drawdown endured.
Unlike buy-and-hold investing, swing trading targets shorter price moves and may reinvest realized profits more frequently. Buy-and-hold keeps an investment exposed to longer-term price movements, while swing-trading results depend more directly on trade selection, execution, and exits. The two approaches produce different patterns of returns.
There is no fixed, realistic monthly return for swing trading. Results depend on market direction, trade frequency, position size, execution, and losses. A target is not a dependable monthly outcome, and assuming steady returns can obscure volatility between trades.
In the United States, profits on securities held for less than one year are taxed at ordinary income rates, according to the Internal Revenue Service. Fees and commissions reduce each trade’s net profit, while taxes reduce what remains after gains are realized. Reinvesting only the net amount compounds more slowly than reinvesting gross profits.
Stops help define risk, but they cannot guarantee an exit at the chosen price. For example, a stock bought at $100 may open at $87 after disappointing earnings, despite a stop-loss at $95. That overnight gap creates a 13% decline, enough to erase gains from five or six successful trades returning 2% each. Leverage can magnify both gains and losses, so assess exposure before trading.
Drawdowns also slow compounding: a 30% decline requires a 42.9% gain on the reduced balance to recover. A 50% drawdown requires a 100% gain. Position sizing, disciplined exits, and avoiding larger trades after losses help limit the damage a losing streak can do.
Swing trading holding periods and overnight exposure
A swing trade lasts long enough to target a short-term price move, but not indefinitely. Holding time affects which setups suit your strategy and how much overnight risk your portfolio carries.
Typical Holding Periods
Swing trades commonly last 2-10 days, though some positions remain open for a couple of weeks. A swing trader generally seeks to benefit from a price move across several sessions, unlike a day trader who closes positions within the same trading day. The planned holding period matters because it shapes the entry, target, and exit conditions. A setup that needs more time may not suit a strategy built around a brief move.
Stock Selection and Overnight Exposure
Stock selection means choosing securities whose liquidity and price movement fit the intended holding period. Average daily volume above 1 million can support easier trade execution, while an average true range (ATR) of 1.5%-5% indicates a range of movement some swing traders look for. These measures inform analysis; they don’t determine a trade’s direction. A moving average can help frame trend conditions alongside them.
Every position held beyond the close carries overnight exposure. Company earnings, economic news, and other developments can move prices before the next session opens. After a price gap, a stop-loss may not execute at its set price, so your actual exit can differ from the planned one. Holding over a weekend adds another period when markets are closed and new information may emerge.
Match the holding period to the setup rather than forcing a trade to last longer. For example, if a breakout thesis depends on follow-through over several sessions, a swing trading strategy can define what continued strength looks like and what would invalidate the setup. A genuine breakout can produce a 5%-15% move within a swing-trading timeframe, but the move’s size and timing vary.
For a structured view of potential setups, review swing trade opportunities alongside your intended holding period and overnight exposure.
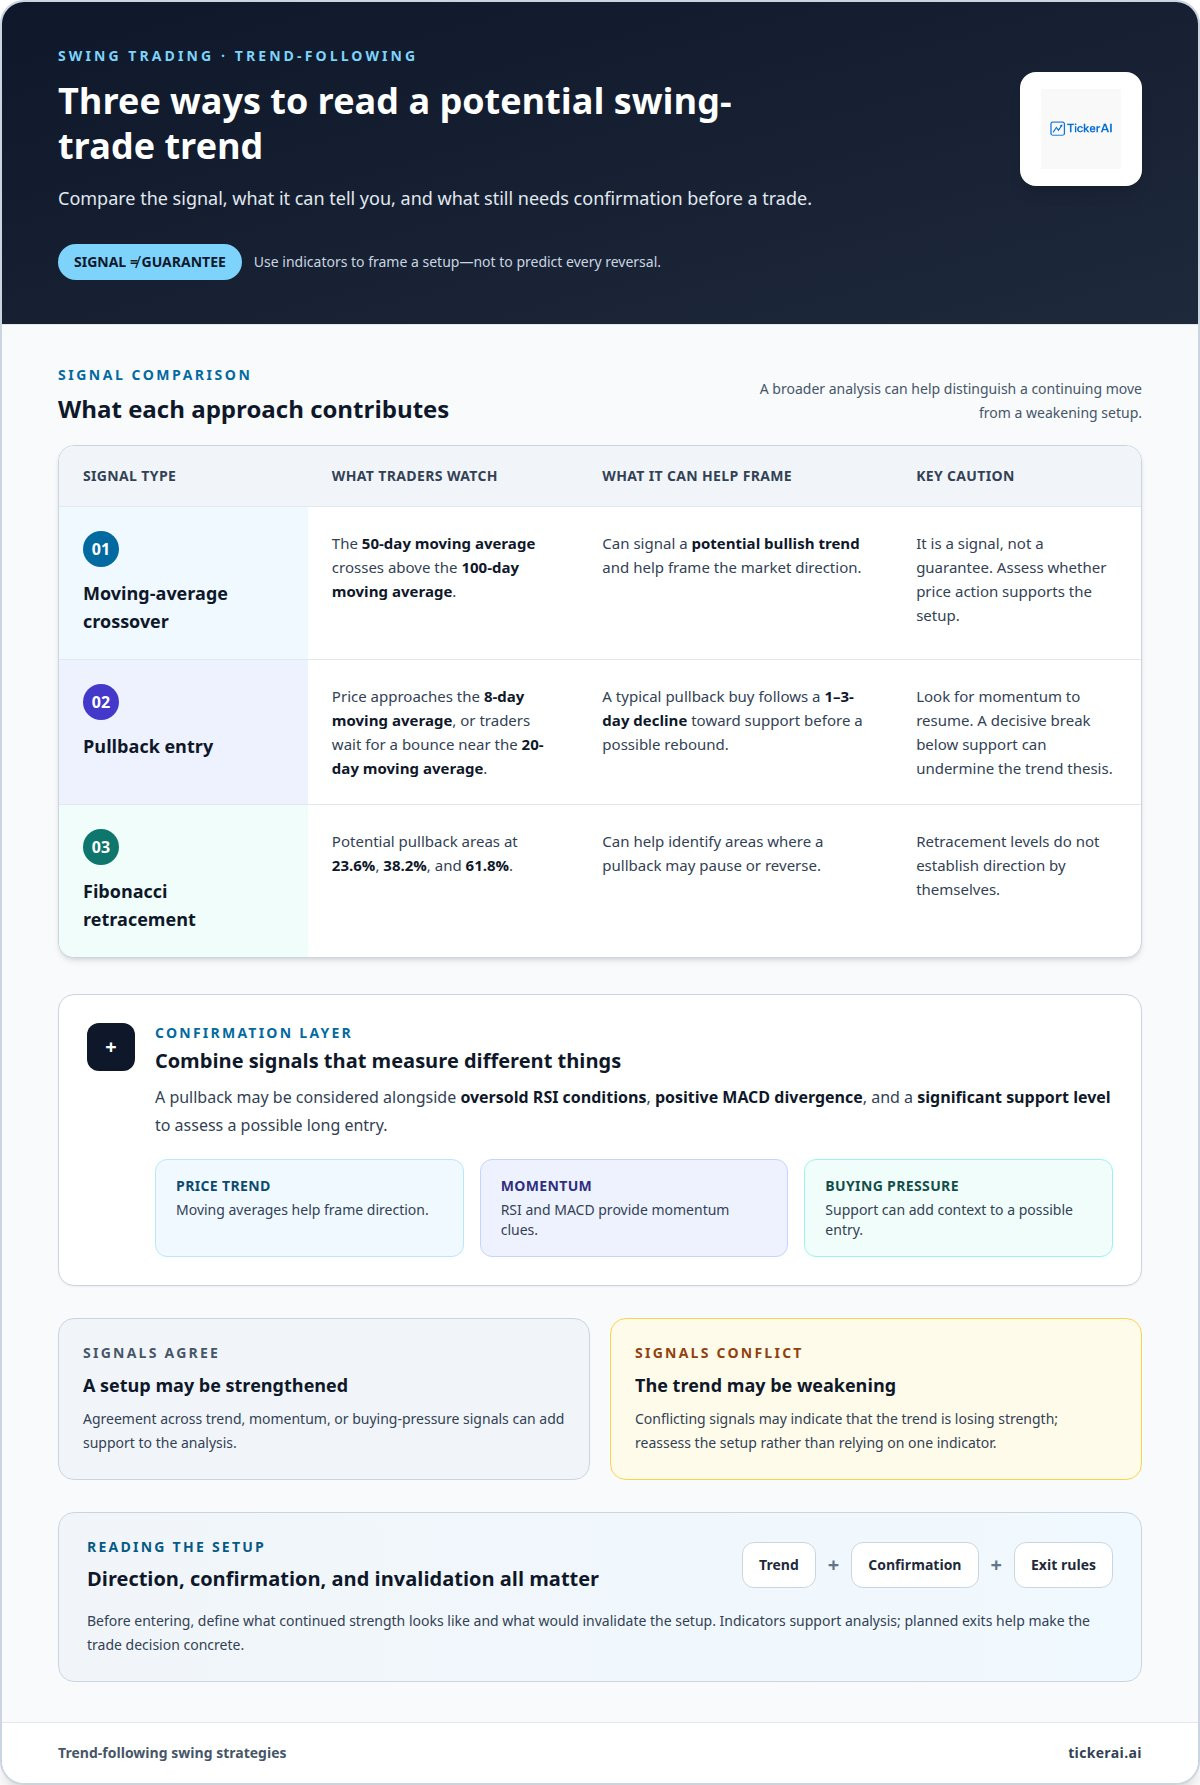
Trend-following swing strategies
Trend-following strategies aim to capture a continuing price move rather than predict every reversal. A 50-day moving average crossing above a 100-day moving average can signal a potential bullish trend. It’s a signal, not a guarantee. Investors can use it to frame direction, then assess whether price action supports the setup before entering trades.
Pullbacks offer another entry approach. Some swing traders watch for price to touch the 8-day moving average, while others wait for a bounce near the 20-day moving average. A typical pullback buy follows a 1-3-day decline toward support before a possible rebound. The key distinction is whether momentum resumes. A decisive break below support can undermine the original trend thesis.
Moving averages are most useful as part of a broader analysis. Traders may combine a pullback with oversold RSI conditions, positive MACD divergence, and a significant support level to confirm a possible long entry. Each signal measures something different: price trend, momentum, or buying pressure. Signals that agree can strengthen a setup, while conflicting signals may suggest the trend is weakening.
Fibonacci retracement levels, including 23.6%, 38.2%, and 61.8%, can help identify areas where a pullback may pause or reverse. They don’t establish direction by themselves. For example, a stock in an uptrend that retraces toward 38.2% and holds support may present a pullback setup. A move through support instead may invalidate the entry idea and leave the trader exposed to further losses.
Scale matters. A 3%-5% pullback may fit a continuing uptrend, while a 10% decline can signal that the trend is breaking. Traders can define the price behavior that confirms momentum, the level that invalidates the setup, and the exit response before taking a position. That framework helps distinguish a trend pullback from a reversal and keeps each trade tied to a clear signal.
Position sizing and predefined exit criteria
Position size links a trade’s planned exit to the capital at risk. First, identify the price that invalidates the setup. Then choose a position size so a move to that level won’t threaten your overall capital. A stop defines the intended loss, but an overnight gap can lead to a different fill. Include that possibility in your risk calculation.
One framework limits risk to 2%-4% on any trade. This is a ceiling, not a target to use automatically. A volatile setup or closely spaced positions can make the same nominal risk more consequential. Keeping no more than 10%-15% of an account in swing trades at the same time can also limit concentrated exposure.
Compare the potential gain with the planned loss before entry. For example, risking $1 per share for a potential $3 gain creates a 1-to-3 risk-to-reward relationship. By contrast, risking $1 for a $0.75 gain is generally unattractive unless the win rate is exceptionally high. Technical analysis can help locate support, resistance, and invalidation levels, but position size determines the capital exposed if the analysis fails.
Define exits before a trade opens. A decisive close below the short-term 5-day moving average can serve as an exit signal. A first profit goal of 5% to 10% offers another reference, while resistance or a weakening trend can shape the actual exit. Some traders sell part of a position as price advances, then manage the remainder against a defined signal.
A trader can have half of their trades end positively and still make money when average losses remain small relative to average gains. That arithmetic breaks down when a losing trade grows substantial or a trader increases size to recover. Day traders and swing traders both face the temptation to override a plan after a loss. Keep the next position tied to its setup, not the previous result. For trade ideas with defined setups, explore swing trade setups and assess how each fits your risk limits.
TickerAI: Swing Trade Setups
TickerAI offers Swing Trade Setups to help traders identify potential opportunities aligned with their strategies. Its AI Stock Opportunity Discovery and Smart Watchlist & Alerts help surface market movements and organize tickers for monitoring. Use these tools to support your analysis, then apply your own position sizing, risk limits, and exit criteria.
For ideas beyond shorter-term trades, TickerAI also provides Long-Term Investment Ideas. These offerings can help distinguish swing-trading opportunities from ideas suited to a longer investment horizon. Neither replaces a defined plan: holding period, overnight exposure, and risk tolerance still shape each decision.
Contact TickerAI to explore its Swing Trade Setups and related market insights.
Make Your Next Trade Plan Deliberate
Treat compounding returns with swing trading as a process to evaluate, not an outcome to assume. Base each new position on a clear thesis, a defined risk limit, and an understanding of what would change your view. Review completed trades for patterns: which setups followed your plan, where execution drifted, and how losses affected later decisions. This feedback makes trading a more structured decision-making process.
TickerAI can support that process with AI Stock Opportunity Discovery, Swing Trade Setups, and Smart Watchlist & Alerts. Use these tools to surface opportunities and organize market signals, while keeping trade selection and risk decisions grounded in your own plan. For a next step, contact TickerAI to discuss swing trading. Build your process with care, refine it through disciplined review, and move forward with greater clarity.
Frequently Asked Questions
How much money do you need to swing trade?
There’s no universal minimum. Swing trading can technically start with $1,000, while $5,000 is a suggested starting amount and $10,000 or more allows more room for position sizing. The balance you need depends on share prices, stop distances, and how many positions you plan to hold. A smaller account can make it harder to keep each trade’s risk proportionate.
How does compounding work with swing trading profits?
Compounding returns with swing trading means adding realized, after-cost profits to the capital available for later trades. If you keep a gain in the account, future returns can apply to a larger balance; a loss reduces the base instead. Reinvesting profits rather than withdrawing them changes the capital available for subsequent trades, but it cannot determine whether those trades succeed.
How to calculate compounded returns for swing trading?
For a single period, divide the ending balance by the starting balance, then subtract one. To calculate an average compounded return over multiple periods, use: (ending balance ÷ starting balance)^(1 ÷ number of periods) − 1. Use consistent periods, such as months or years, and calculate with returns after trading costs. This measures growth across the full period, not each trade’s return.
What position sizing and risk management rules help protect a swing trading account?
Size a position according to the loss you would face if its exit level is reached, not the number of shares you would like to own. Assess your combined exposure too: several positions in the same sector may react to one news event and incur correlated losses. Define the exit before entry, account for overlapping risks, and don’t increase position size simply to recover from a loss.
How does reinvesting swing trading profits affect long-term account growth?
Reinvesting keeps realized profits in the account, where they can contribute to capital for future trades. The effect is cumulative: withdrawing gains interrupts that growth, while losses, commissions, and other trading costs reduce the amount available to reinvest. Track account growth using net results, not just winning trades, so your calculation reflects what remains after costs and withdrawals.
What are examples of swing trading compound growth over 1, 5, and 10 years?
This applies the same hypothetical monthly rate across each period. It assumes there are no losing months, withdrawals, taxes, or trading costs, so it illustrates compounding arithmetic rather than forecasting trading results.


