

A signal is a prompt to examine a market setup, not an instruction to trade. Buy and sell signals software applies selected rules to indicators such as MACD crossovers to flag possible entry or exit conditions. Use it as an analysis tool, not as a source of direct trading or investment recommendations.
Signals can help filter market activity, but their value depends on understanding how they are generated. A crossover, for example, shows a relationship between indicator lines; it does not predict what happens next. Assess the broader trend, timing, and risk before making a decision.
This article explains how signal software processes indicators, which markets it can support, and how MACD and other crossovers generate alerts. You’ll also learn what to look for in a signal workflow and how to use alerts as one input in your own analysis.
Key Takeaways
- Treat automated signals as prompts to investigate a setup, not instructions to enter or exit a trade.
- Learn how MACD and other indicator crossovers can flag momentum shifts, and why context matters when interpreting them.
- Match a platform’s market coverage and user-defined parameters to the assets and timeframes you want to analyze.
- Use TickerAI’s stock opportunity discovery, swing trade setups, watchlists and alerts, or long-term investment ideas to support your market research.
What is a Buy Sell Signal Software?
Signal software applies indicator rules to market data and flags possible setups. Treat each alert as a prompt for analysis, not an order or forecast.
Automated Intraday Signals
For intraday trading, a scanner can monitor selected securities and flag conditions such as a price crossing a chosen level. You set parameters, including the instrument and chart interval, and the software identifies matching conditions. Before acting, inspect the trigger and price movement, then consider whether the setup fits your trading plan. Automation can surface opportunities, but you still need to assess risk.
Trading Style Coverage
Match signal timing to your intended holding period. Day trading and other intraday approaches focus on movements within a session, while swing trading targets moves over a longer window. Short-term strategies may hold positions across several sessions; positional and long-term approaches assess broader trends. Compare the software’s available intervals and signal logic with your timeframe rather than assuming one alert frequency suits every style.
What are the best buy and sell signal platforms in the United States? No single platform is best for every trader. Compare supported markets, configurable indicators, alert delivery, and how clearly each platform explains its signals.
Is this software regulated in the United States, and what disclosures should I check? Whether rules apply depends on the provider’s activities, not simply the software label. Read disclosures about educational use versus recommendations, automated execution, performance methods, conflicts of interest, and trading risks.
How accurate are trading signals? Accuracy depends on the strategy tested and the measurement method. Check which signals and time periods were counted, whether results were tested beyond the development data, and whether costs and losing trades were included. A headline success rate alone can obscure important details.
Stock, futures, options, and intraday trading involve substantial risk, and losses can exceed initial capital. Use signals for study, conduct your own research, and make decisions within your risk limits. When comparing packages, review the terms and included access, such as supported markets, analysis tools, and alert features. Don’t judge a package by its label alone.
MACD and other crossover-based indicators
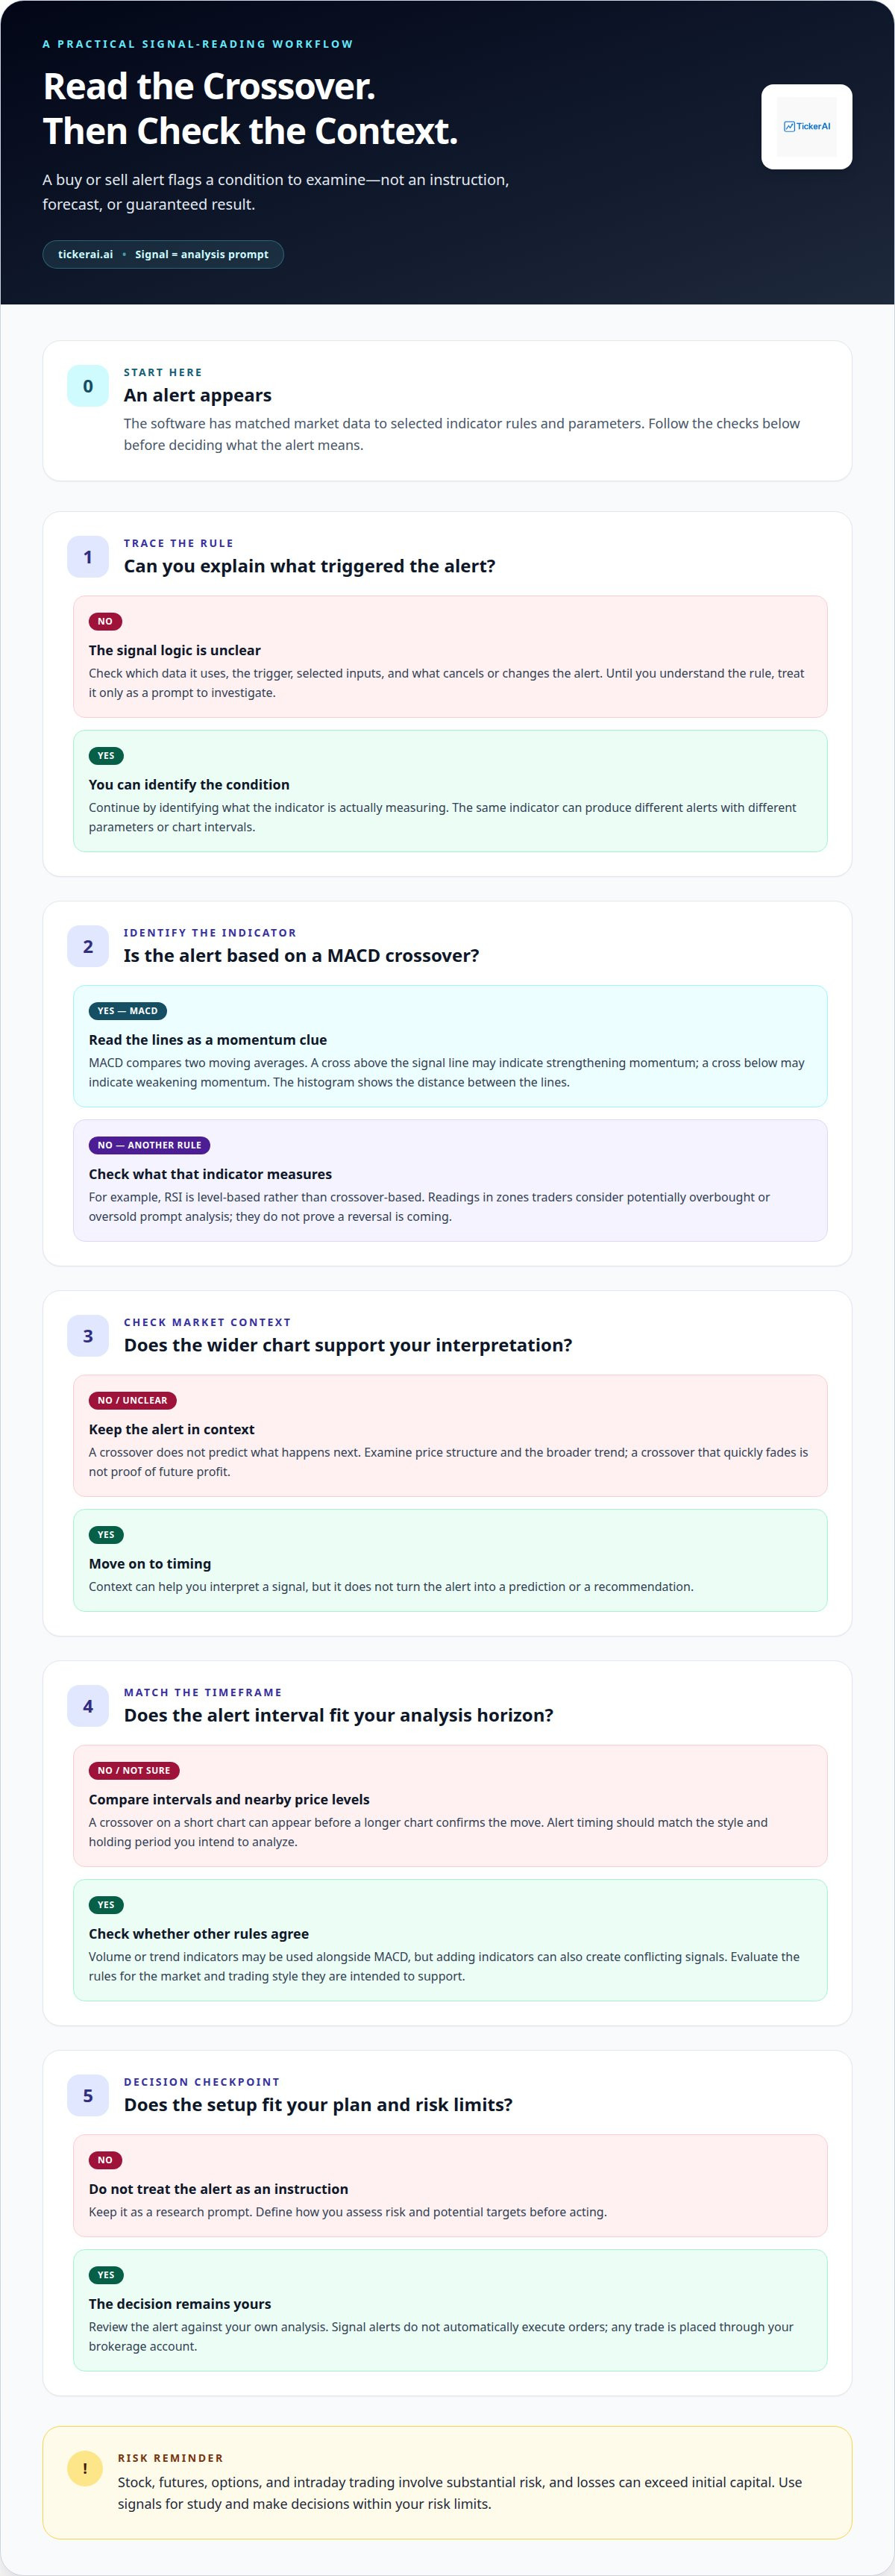
MACD compares two moving averages to track momentum. When its MACD line crosses above the signal line, traders may interpret it as strengthening momentum; a downward cross may indicate weakening momentum. The histogram shows the distance between the lines, helping technical analysis distinguish expanding momentum from a crossover that quickly fades. None of these conditions establishes future profit. Check price structure and the broader trend before interpreting a signal.
On intraday charts, timeframe selection matters. A crossover on a short chart can appear before a longer chart confirms the move, so compare the signal with another timeframe and nearby price levels. Traders may combine MACD with volume or trend indicators, but adding indicators can also create conflicting signals. Evaluate each rule against the market and trading style it is intended to support.
RSI is level-based rather than crossover-based: it measures the pace of recent price changes, and traders watch for readings in zones they consider potentially overbought or oversold. A zone prompts analysis; it does not prove a reversal is coming. In a strong trend, RSI can remain elevated or depressed while price continues in the same direction. Compare the reading with the trend and price action.
Customizable AFL scripts let AmiBroker users express indicator conditions as rules, such as flagging a MACD cross only when price meets a chosen filter. Review the formula, inputs, and chart interval so the alert matches the intended test. MT4 indicators also depend on chart timeframes: an alert based on one interval may differ from one on another. Before relying on either setup, examine how it generates signals and test it on relevant historical charts. Years of experience are not a substitute for transparent logic; dedicated analysis should make the rule understandable and repeatable.
How buy and sell signal software works
A signal system turns market data into conditions traders can review. First, it reads inputs such as price movement, volume, or a technical indicator. An algorithmic rule then checks whether those inputs meet selected parameters. If they do, the software displays a possible buy or sell signal. For example, a rule might flag a currency pair when its price crosses a selected moving average. The alert identifies a condition, not a reliable prediction or guaranteed result.
To set up alerts alongside a brokerage account, choose the asset and signal conditions in a platform that supports them, then direct alerts to an available notification channel. Review each alert and place any trade through your brokerage account yourself; signal alerts do not automatically execute orders.
Assess a signal by tracing its logic. Identify the data it uses, the trigger that activates it, and the event that cancels or changes it. Then compare the alert with the relevant chart and your trading plan. An intraday rule may use a shorter chart interval than a swing-trading system, so the same indicator can produce different alerts across timeframes. Define how you will assess risk and potential targets before acting.
Signal software can display indicators based on user-selected parameters. Those settings determine what the system scans and when it reports a match. A narrow rule may produce fewer alerts, while a broader rule may flag more conditions to review. Understand each input and test how changing it affects the output instead of assuming one configuration suits every market.
Use each alert as a decision checkpoint: inspect the trigger, compare it with market context, and decide whether it fits your plan. In this workflow, signal software does not support automated trading or robo trading. You remain responsible for reviewing the setup and submitting any order through your brokerage account.
What software provides buy and sell signals for stocks, options, forex, and crypto?
Signal platforms differ in the markets and instruments they cover. A stock scanner may screen listed shares using price or indicator conditions, while forex tools monitor currency pairs. Options analysis can involve both the underlying stock and contract characteristics. Crypto signal tools depend on the digital assets and market data available to them. Start by matching supported instruments to the assets you plan to analyze.
Coverage alone does not show how useful a platform’s signals will be. Review its data inputs, indicator rules, chart intervals, and alert format. For example, a stock alert based on a moving-average crossover may not transfer directly to an options contract, where the contract’s behavior also matters. For forex, check that the tool supports the currency pairs and timeframes relevant to your analysis. Clear rules make it easier to understand why an alert appeared.
Use this comparison sequence before choosing a signal workflow: identify the market, confirm the instrument, then inspect how the platform generates and presents signals. Check whether it offers customizable filters or lets you review the underlying chart. A platform that supports several asset classes may still offer different features for each. Confirm that its analysis suits your trading style rather than assuming every market uses the same settings.
- Stocks: Review supported shares, screening conditions, and chart-based signal logic.
- Options: Check whether signals relate to the underlying asset, the contract, or both.
- Forex and crypto: Match supported currency pairs or digital assets with the data and intervals you need.
For stock-focused research, explore AI Stock Opportunity Discovery to surface market opportunities for further analysis. It’s a relevant next step when your priority is identifying stock setups rather than finding a single tool for every asset class.
The best platform depends on the assets and markets you want to analyze. Choose one that supports those instruments and offers signal rules, filters, charts, and alerts suited to your trading style.
TickerAI: AI Stock Opportunity Discovery
TickerAI helps stock traders surface opportunities through AI Stock Opportunity Discovery, curated Swing Trade Setups, Smart Watchlist & Alerts, and Long-Term Investment Ideas. Use these tools when you want a structured stream of stock research to review alongside your own analysis, rather than scanning every ticker manually.
Use watchlists and alerts to focus on selected opportunities, then assess each setup against your strategy and risk limits. Swing Trade Setups support research into shorter-term market moves, while Long-Term Investment Ideas address a different horizon. These offerings help organize stock analysis; they do not execute trades or replace your judgment.
Explore TickerAI’s offerings at tickerai.ai.
Make Your Next Signal More Actionable
Build a repeatable process around the alerts you choose to follow. Before acting, define what would make a setup relevant, what would invalidate it, and how you’ll review the result. An alert can prompt you to inspect a chart and compare it with your plan, rather than trigger an automatic decision. This routine makes buy and sell signals software one input in a considered process.
Keep your next step focused. Choose the market and trading style you want to research, then assess whether the platform’s tools support that task. Clear criteria make it easier to compare signals with your analysis and keep decisions aligned with your strategy.
If you’re ready to explore a stock-focused research workflow, visit TickerAI. Start with a clear question, review the available tools, and build your next step with purpose.
Frequently Asked Questions
How much do buy and sell signals software subscriptions cost?
Subscription costs vary by provider and package, so compare included features rather than price alone. Check whether access covers your markets, indicator tools, alert delivery, and historical analysis. TickerAI offers Pro and Full-Access subscriptions; compare the features in each tier with your research workflow and review the terms before subscribing. Avoid paying for tools or market coverage you do not plan to use.
Which platforms offer free buy and sell signals or trial periods?
Free access and trial periods vary by platform and can change, so review the provider’s current terms. Distinguish a limited free tier from a time-limited trial: one may restrict features, while the other may end or convert under stated terms. Before relying on either, confirm which assets, alerts, and analysis tools are accessible during the offer.
How do buy and sell signals software generate alerts and what indicators does it use?
Software generates an alert when market data meets a rule, such as a MACD line crossing its signal line or RSI reaching a selected level. The alert may depend on whether the condition occurs during a candle or at its close, which affects timing. Review the trigger definition and chart interval so you know exactly what produced the notification.
How do I compare signal software by asset coverage, alert speed, backtesting, and broker integrations?
Compare platforms using the same asset and timeframe, then check four details: supported instruments, how quickly alerts reflect market data, whether historical tests reveal their assumptions, and which broker connections are available. For backtests, inspect the tested period, entry and exit rules, and treatment of costs. For integrations, distinguish viewing signals from sending orders; these are separate functions.
What risks and limitations come with trading based on buy and sell signals?
Signals can arrive late, produce false triggers, or perform differently as market conditions change. A strategy fitted closely to historical data may not behave the same way in live markets. Leverage can magnify losses, and stock, futures, options, and intraday trading involve substantial risk, including losses that can exceed initial capital. Set risk limits and assess each setup independently instead of following alerts automatically.
What are the best buy and sell signal platforms in the United States?
No single platform is best for every trader. Compare market coverage, configurable indicators, alert delivery, and how clearly each platform explains its signals.


