

Can automated chart pattern recognition software surface useful setups without making the decision for you? It can scan more charts than most traders can review manually, but a detected formation is a candidate for further research, not a trade signal.
If you struggle to review a watchlist consistently, automation can broaden the search. The challenge is interpretation: tools may label formations differently, and a pattern alone doesn’t show whether a setup fits your strategy or the market context.
This guide explains how pattern detection works, which formations software may identify, and how to assess its output. You’ll learn what to look for in detection status, scan controls, data quality, and historical testing, along with common limits to keep in mind.
The goal isn’t to hand decisions to an algorithm. Use automated discovery as one input in a defined research process: review the chart, assess the context, and apply your own criteria. Broader market research, including AI-powered opportunity discovery and curated swing trade setups, can complement that review without replacing it.
Key Takeaways
- Learn how automated chart pattern recognition software turns price data into formations you can review across selected charts.
- Compare tools by detection status, scan controls, chart context, and clearly documented capabilities, not labels alone.
- Use a repeatable review sequence to assess each detection and decide whether it merits further research.
- Keep chart-pattern detection distinct from broader stock-opportunity discovery. Each can serve a different research purpose.
- See how TickerAI’s AI-powered opportunity discovery, curated ideas, smart watchlists, and alerts can complement chart review.
What automated chart pattern recognition software does, and what it does not do
Automated chart pattern recognition software scans price-chart data for formations that match criteria set by the tool, then marks or reports possible detections. It can help traders find candidate patterns across charts, but a label is not a forecast. Detection alone doesn’t validate a setup, determine position size, manage risk, or place a trade.
The result depends on the data the system processes, how it defines each formation, the timeframe scanned, and how its rules are implemented. A pattern detected on daily bars may not appear on an intraday chart. A different tool may also mark the same price movement differently. Treat the output as a prompt to inspect the chart, not proof that price will move in a particular direction.
How does chart-pattern recognition software identify formations?
At a basic level, the software processes time-series price data and tests it against formation criteria. Depending on its design, it may identify swing highs and lows, compare slopes or relative price levels, and assess whether the data fits a configured shape. This is a specialized application of pattern recognition, where input data is assessed for recurring structures.
Definitions matter. One implementation might require price to cross a boundary before labeling a breakout; another might mark a formation while it is still developing. Tools can also differ in confirmation thresholds, the points used to draw pattern boundaries, and how a detection is displayed. This can explain why charts don’t always agree, even when they show the same instrument and timeframe.
A displayed label answers a limited question: does the data meet this tool’s detection criteria? It doesn’t establish whether the formation is complete, whether the surrounding market context supports the interpretation, or whether a trade suits a particular approach.
Which chart patterns can automated tools recognize?
Supported patterns vary by platform, so don’t assume a tool’s pattern list represents universal coverage. Common categories include triangles, double tops, and double bottoms. Some systems may identify other formations, but the available patterns and the rules used to define them depend on the implementation.
Patterns are often described by their potential role:
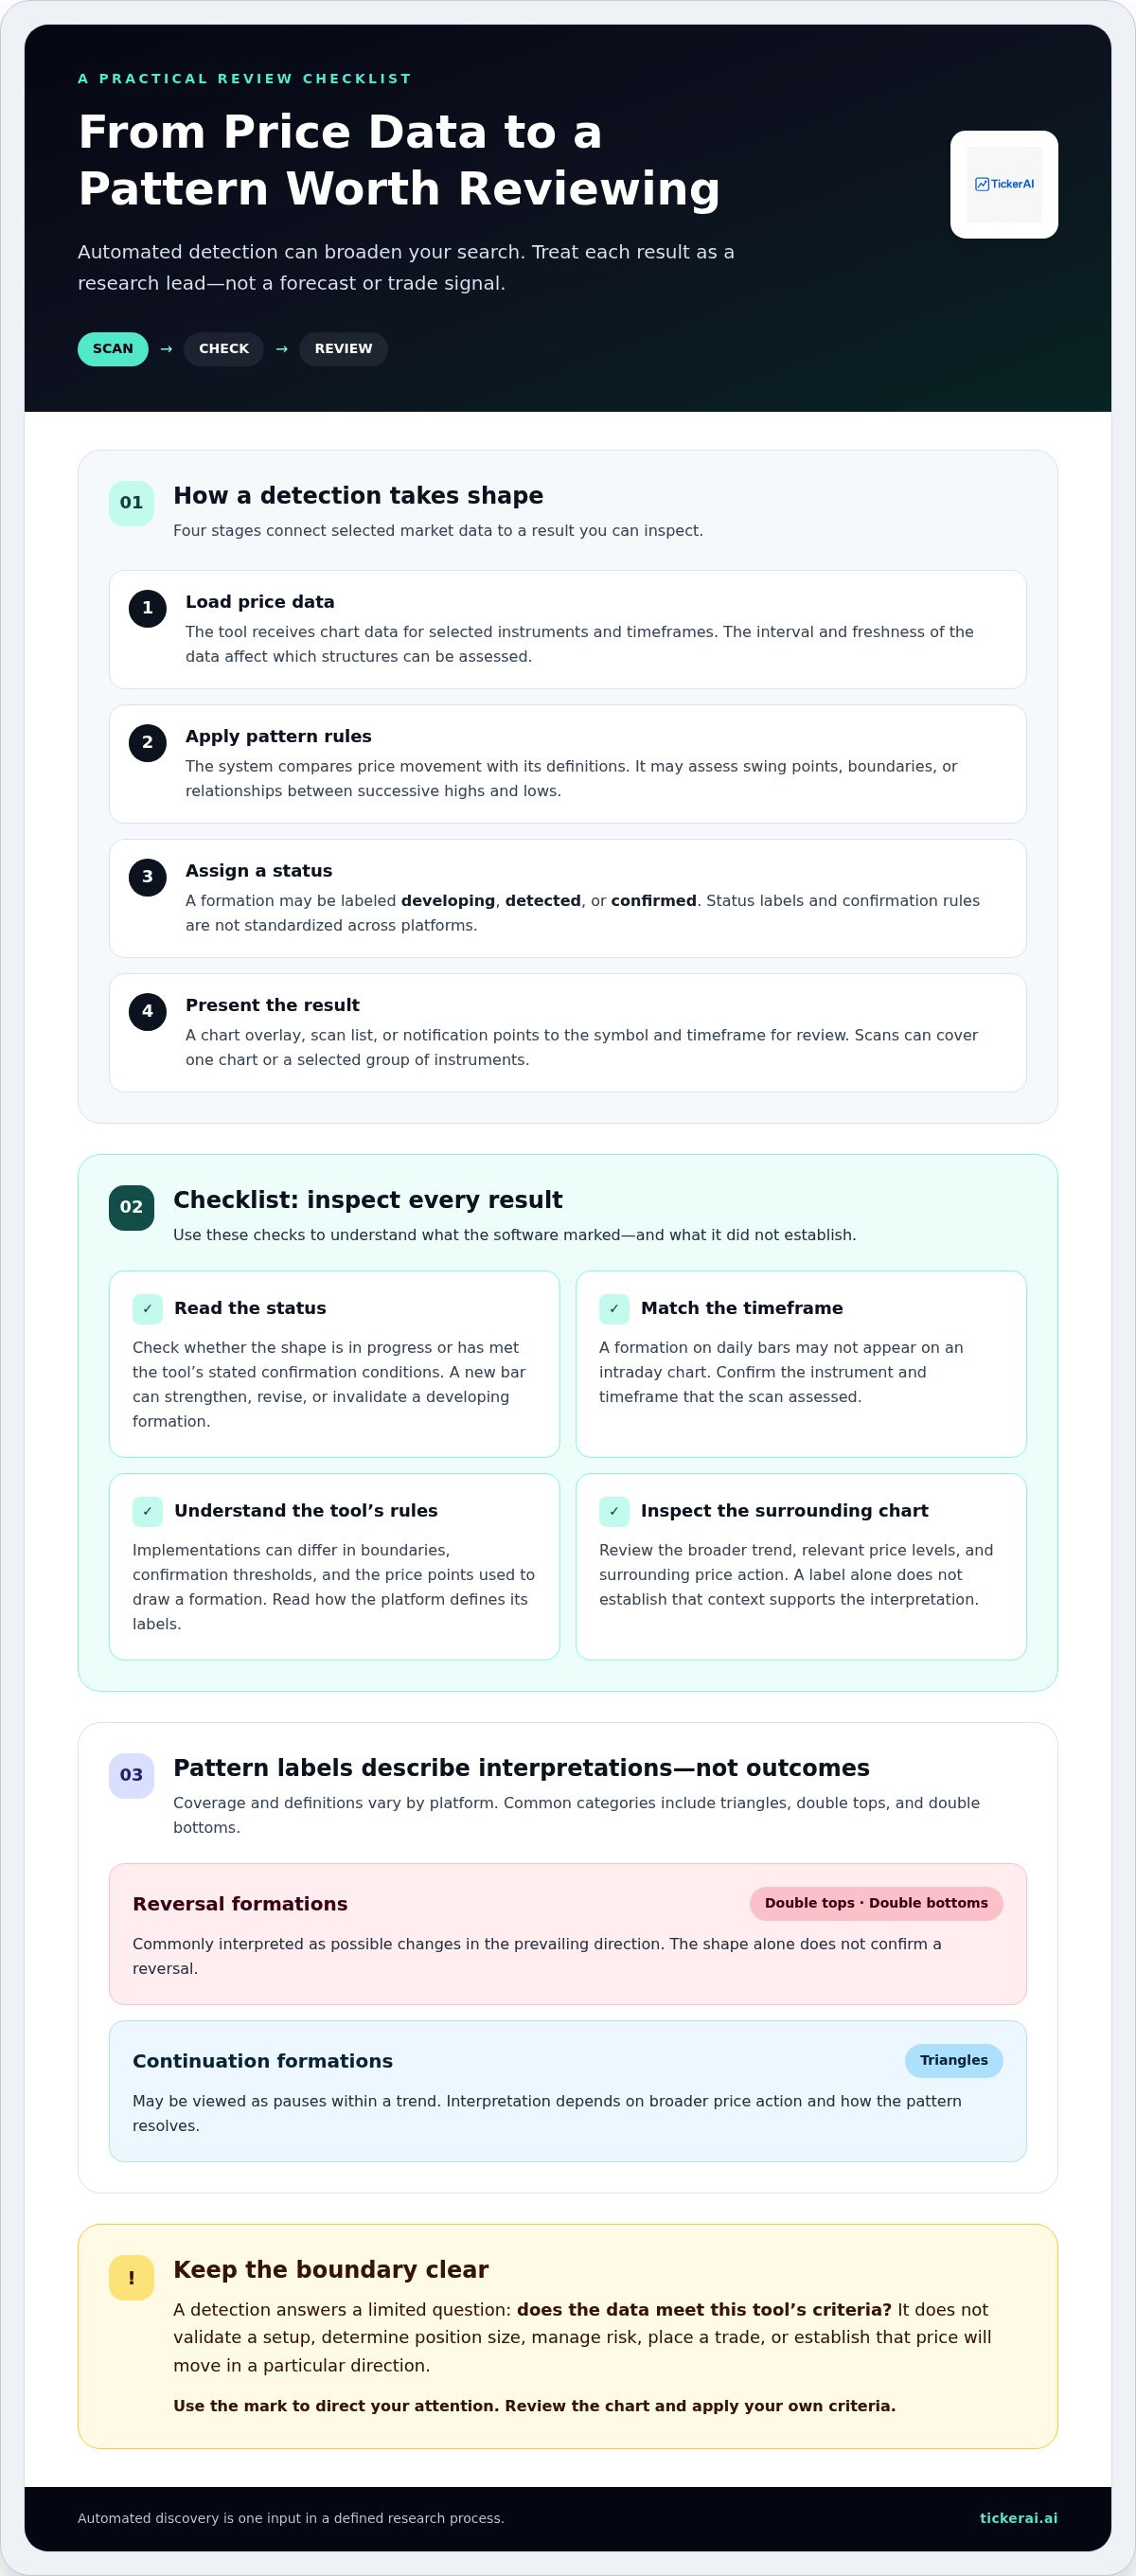
- Reversal formations: Double tops and double bottoms are commonly interpreted as possible changes in the prevailing direction. The shape alone doesn’t confirm a reversal.
- Continuation formations: Triangles may be viewed as pauses within a trend, but their interpretation depends on the broader price action and how the pattern resolves.
These labels describe common analytical interpretations, not fixed outcomes. A double top after an extended advance may be read differently from a similar shape in a sideways market. Before relying on a detection, check the timeframe, surrounding trend, relevant price levels, and whether the formation is developing or confirmed under the tool’s rules. That context turns an automated mark into a more useful research lead.
How automated chart pattern recognition moves from price data to a detection
A detection starts with market data, but several steps turn incoming prices into a result a trader can review. In automated chart pattern recognition software, the broad process usually looks like this:
- Load price data. The tool receives chart data for selected instruments and timeframes. The interval and freshness of the data affect which structures can be assessed.
- Apply pattern rules. The system compares price movement with its definitions for supported formations. It may assess swing points, boundaries, or relationships between successive highs and lows.
- Assign a status. Depending on its rules, a tool may mark a formation as developing, detected, or confirmed. These labels aren’t standardized across platforms.
- Present the result. A chart overlay, scan list, or notification directs attention to the symbol and timeframe for review.
Depending on the tool’s scan controls, this sequence can run against one chart or a selected group of instruments. Scanning broadens coverage, but it doesn’t remove the need to open each result and examine the surrounding price action.
What happens between a chart update and a pattern label?
A developing formation can change as new bars arrive. A fresh high, low, or close may reshape a boundary, meet a confirmation rule, or make the price action no longer fit the tool’s criteria. A detected pattern can change as new price data arrives because each update may strengthen, revise, or invalidate the formation.
Some tools distinguish an in-progress shape from a completed formation; others display both with different labels or visual treatments. Confirmation and removal rules vary. One implementation, for example, may require a close beyond a boundary, while another may use different criteria. Read the tool’s explanation of each status so you know whether a result is provisional or has met its stated conditions.
How do chart scans and alerts extend pattern detection?
Scanning applies detection rules across selected symbols or charts, reducing repetitive chart-by-chart review. Narrow the scan to the instruments and timeframes relevant to your research, then inspect the results. Available filters and scan frequency depend on the platform.
Alerts, when supported, can prompt you to review a formation when the tool identifies or updates it. Availability, trigger conditions, and configuration vary. An alert doesn’t confirm that a pattern is meaningful; it signals that a chart may warrant a closer look.
- Open the chart: Confirm the symbol, timeframe, and marked price structure.
- Check the status: Determine whether the tool identifies a developing or completed formation.
- Assess the context: Review nearby price action before deciding whether the detection deserves further research.
For a wider research process, TickerAI’s AI-powered opportunity discovery, curated swing trade setups, smart watchlists, and real-time alerts can complement chart review. Explore AI stock opportunity discovery as a separate source of market research, not as a chart-pattern detection feature.
How to evaluate automated chart pattern recognition software beyond its pattern list
A long pattern menu can look impressive, but it doesn’t tell you how useful the detections will be in your workflow. Evaluate the system’s rules and outputs, not just the pattern names. Look for clear explanations of what counts as a detection, how scans are controlled, and how the tool presents uncertainty or changing formations.
Use this comparison framework to separate practical capabilities from broad claims such as “AI-powered” or “intelligent.” Those terms alone don’t explain which data the tool processes, how it reaches a detection, or what you can do with the result.
Pattern coverage: Which formations and pattern families are supported? Does the list match the formations you actually review, or is it simply extensive?
Detection status: Can you distinguish developing, confirmed, and invalidated formations? Are the criteria for changing a status explained?
Scan controls: Can you choose the instruments and timeframes to scan? Can you narrow results to the charts relevant to your research?
Chart context: Are detections shown on the chart with visible boundaries or other useful context? Can you inspect the marked area instead of relying on a label alone?
Workflow fit: Can you move from a scan result to chart review without unnecessary steps? Consider whether the output fits your existing research process.
Which software capabilities matter when comparing pattern detectors?
Start with patterns you know how to assess. A broad catalog isn’t automatically better if the rules behind its labels are opaque or the formations don’t fit your analysis. Then check whether detections appear directly on charts and whether you can filter scans by symbol or timeframe. Clear explanations of status, limitations, and chart context make it easier to judge what a result represents.
“AI-powered” describes an approach, not a measurable capability. Look for specific documentation: what the system analyzes, what triggers a label, and what happens when a formation changes. If explanations are vague, don’t treat marketing language as evidence of detection quality.
How should traders assess false positives and changing formations?
A false positive is a detection that doesn’t hold up under closer chart review or subsequent price action. For example, a label may appear on a developing formation that later fails to meet the tool’s confirmation criteria. Check whether the platform makes provisional status visible, updates detections as new data arrives, and explains when a pattern is removed or invalidated.
Historical examples can help you understand how a tool displays formations, but they don’t establish future reliability. A stronger evaluation uses relevant, systematic testing that accounts for the instrument, timeframe, detection rules, and changing market conditions. Don’t infer performance from a handful of selected charts.
Evaluation checklist: Compare supported patterns, transparent detection rules, status handling, scan controls, chart context, and fit with your research workflow.
A practical workflow for reviewing software-detected chart patterns
A scan result is the start of a review, not its conclusion. Use the same sequence each time to separate what the software detected from what you observe and decide. This helps prevent an automated label from anchoring your later judgment.
What should you check before acting on a detected pattern?
Start with the result itself. Confirm the instrument, timeframe, and date, then check whether the formation is developing or complete according to the software’s stated criteria. Make sure the marked boundaries align with the price action shown. If the result is stale or the chart settings don’t match your intended review, pause and resolve that first.
Next, assess the surrounding chart independently. Review nearby price action and relevant support or resistance levels. These can inform your interpretation, but they don’t confirm a pattern or guarantee a particular move. Ask whether the formation is clear in context, or whether the label makes a noisy or incomplete structure look more decisive than it is.
Before drawing a conclusion, write down what would invalidate your interpretation. That might be a change in the formation’s marked boundaries or price action that no longer meets the tool’s criteria. Use the software’s definitions where available. This makes your reasoning testable instead of letting the label quietly set the terms.
How can a trader keep automated detections in context?
Keep three stages distinct: detection, contextual review, and decision. The software can prioritize charts to inspect. Your review should determine whether the formation is coherent and relevant to your research. Only then decide whether the result merits further consideration. A disciplined process can end with “no action” or “insufficient context.” Both are valid research outcomes.
- Log the detection: Record the symbol, timeframe, date, pattern label, and status shown by the tool.
- Note your review: Summarize the chart context, what supports your interpretation, and what could invalidate it.
- Document the outcome: Mark the result for further research, dismissal, or later review, and state why.
Apply the same recordkeeping to detections you dismiss as to those you keep. Consistent notes can help you spot whether certain labels, timeframes, or conditions need closer scrutiny. For broader context on interpreting algorithm-generated signals, see this AI stock signal interpretation guide. A systematic investment research guide can also help place chart review within a wider discovery process.
For research beyond chart formations, explore TickerAI’s AI-powered stock opportunity discovery, alongside its curated ideas, smart watchlists, and alerts. These broader research inputs can complement your review; they aren’t automated chart-pattern detections.
Where chart-pattern software fits in a broader AI stock-discovery workflow
Chart-pattern detection and stock-opportunity discovery answer different research questions. A chart tool looks for defined price formations in selected instruments and timeframes. A broader discovery process can surface stocks or ideas for examination without requiring a particular chart shape to appear first. Used together, these inputs can widen the research funnel while keeping each signal’s role clear.
What does chart-pattern recognition add to stock discovery?
Pattern recognition provides a chart-focused lens. It can flag formations such as triangles or double bottoms for closer technical review, helping narrow a large set of charts to candidates worth examining. But a formation is only one consideration. It doesn’t replace research into other relevant factors, and it shouldn’t be treated as a prediction or a complete assessment of an opportunity.
Broader discovery works from the opposite direction: it can surface opportunities across the market, after which a trader may examine charts and other research inputs. Automated chart pattern recognition software is one possible filter within a wider process, not a substitute for market discovery. The two approaches can complement each other, but they remain distinct. A detection tool identifies supported chart structures; a discovery service helps bring other candidates and ideas into view.
How TickerAI supports broader opportunity discovery
TickerAI focuses on AI-powered stock opportunity discovery, not automated chart-pattern detection. Its research offering includes curated swing trade setups and long-term investment ideas, along with smart watchlists and real-time alerts. These provide broader market inputs alongside a separate chart-pattern review, without suggesting that TickerAI generates chart-pattern detections.
TickerAI offers Pro and Full-Access subscription tiers. To put automated discovery in context with other research approaches, read this automated stock market analysis guide.
A practical workflow can use discovery to identify ideas, then bring selected candidates into chart review. A chart formation may add technical context to an idea, while a broader opportunity list can help ensure research doesn’t begin and end with a pattern scan. Keep the inputs distinct, document what each contributes, and apply your own criteria before reaching a research decision.
Explore TickerAI’s AI-powered stock discovery to add broader opportunity research, watchlists, alerts, and curated ideas to your process.
Make your next scan part of a stronger research process
Before your next scan, define what makes a detection worth reviewing. Set criteria you can apply consistently, then use each result to sharpen your research process, whether you keep it for further study or dismiss it. The value of automated chart pattern recognition software lies in directing attention; your review determines what that attention means.
For a wider view of market opportunities, TickerAI brings together AI-powered discovery, curated swing trade setups and long-term investment ideas, plus smart watchlists and real-time alerts. Pro and Full-Access subscriptions provide access to this broader research. Use these inputs alongside chart review, not as a replacement for independent assessment.
Explore TickerAI’s AI-powered stock discovery to add broader opportunity research to your process and keep discovery, chart analysis, and decision-making distinct. Start with a clear research question, then review each signal deliberately.
Frequently Asked Questions
Can automated chart pattern recognition software scan multiple stocks at once?
Some platforms scan selected stocks for supported patterns, while others require chart-by-chart review. Before relying on a scan, check which exchanges or instruments it covers, whether you can narrow results by pattern or timeframe, and how often results refresh. For example, a scan limited to daily charts may not surface a formation developing on an hourly chart. Use scan results to prioritize charts, then assess each candidate against your own research criteria.
Does chart pattern recognition software work with live or developing candles?
Some tools update detections as a candle forms, but behavior depends on the platform’s rules. A pattern may appear during an active candle and change before that interval closes. Check whether the display identifies provisional results and whether confirmation is based on an intrabar price, a candle close, or another documented condition. If the status isn’t clear, wait for the interval to complete and recheck the chart before interpreting the label.
Can automated chart pattern software recognize patterns on different timeframes?
Timeframe support varies, and the same price action can form different-looking structures at different scales. A short-term chart might show a compact triangle while a longer-term view places that movement inside a broader range. Note the timeframe attached to every detection, especially when comparing results from separate scans. If multi-timeframe analysis is available, treat each view as distinct evidence to assess, not automatic agreement between signals.
Are automated chart patterns reliable enough to trade without review?
No. A detection shouldn’t be treated as a guaranteed instruction to trade. A formation may be incomplete, may not fit the surrounding market context, or may later be invalidated. Before acting on an output from automated chart pattern recognition software, inspect the marked price area and understand the tool’s criteria. Ask whether you can explain, in your own words, why the chart merits further consideration without relying on the software’s label.
Can chart pattern recognition software identify formations in cryptocurrency charts?
Some tools support cryptocurrency charts, but coverage depends on the platform, exchange or instrument, data source, and interval. A tool that detects patterns on equities may not support every crypto market or chart feed. Review the platform’s asset coverage and data documentation, then confirm the selected symbol and interval in the result. Crypto trading hours and venue-specific price data can also affect which price structure the software receives and marks.
Do chart pattern tools replace technical analysis indicators?
No. Pattern tools and indicators provide different views of price data, and a platform may offer one, both, or neither. For instance, a chart formation and a momentum indicator may appear to support the same interpretation, but both could be responding to the same recent price move. Consider what each input measures before treating them as separate evidence. Choose tools that answer distinct questions in your process, and avoid counting overlapping signals as independent confirmation.


