

An alert feed can report an 80% win rate and still lose money if its average losses outweigh its wins. That’s why learning how to measure stock alert accuracy takes more than counting winners. You need to know what each alert predicted, how long it had to work, and which rules determined success or failure.
If win-rate claims are hard to compare, inconsistent definitions are often the reason. One service may treat expired alerts differently from stopped-out trades; another may use a different holding period or exit rule. A high hit rate alone doesn’t show whether a signal produced positive returns.
This guide provides a repeatable scorecard. Define each alert’s entry, target, stop, and expiration, then log every signal and score directional accuracy separately from trading outcomes. You’ll also learn how to account for costs and compare alerts on consistent terms instead of relying on selective claims.
AI-powered stock opportunity discovery, smart watchlists, and real-time alerts can provide research inputs. The measurement framework below helps you evaluate those signals consistently, whether you’re reviewing swing trade setups or another alert type.
Key Takeaways
- Separate directional accuracy, target attainment, and profitable execution so each alert is judged against a clear outcome.
- Learn how to measure stock alert accuracy with a consistent record of timestamps, entry zones, targets, stops, and expirations.
- Compare win rate with expectancy, drawdown, and benchmark-relative return for a more complete view of signal performance.
- Check that results include every alert and use reproducible rules, reducing the impact of selection bias, survivorship bias, and cherry-picked periods.
- Use consistency, transparency, fit, and risk context to assess AI alerts and build a disciplined review workflow around smart watchlists.
What Does Stock Alert Accuracy Actually Measure?
Stock alert accuracy measures whether an alert met outcome criteria defined before its result was known. Those criteria might test whether the price moved in the predicted direction, reached a stated target, or produced a profitable trade under specified entry and exit rules. These are separate tests, not interchangeable meanings of “correct.”
Consider a hypothetical alert that identifies a long entry near $50, a $55 target, a $47 stop, and a 10-session horizon. The price might reach $55, passing the target-attainment test. But if it first falls through the stop, the trade outcome may be a loss. A directional test might still count a later upward move as correct, depending on its measurement window. The scoring rule determines the result.
Entry timing, holding period, and exit rules shape every result. A price move that looks favorable on a daily chart may not have been attainable after the alert was published. Likewise, a target reached after the stated expiration shouldn’t count as an on-time hit. To learn how to measure stock alert accuracy, define the event being scored first, then apply that definition to every signal.
What Counts as a Correct Stock Alert?
Before scoring, set the direction, reference entry or entry zone, price level, and evaluation horizon. Also specify how to handle gaps, partial target hits, and a price that touches both target and stop within the same candle. If the available price data can’t establish which came first, use a predeclared conservative rule or higher-resolution data.
A target touch isn’t automatically a profitable trade. The trade-level result depends on whether the entry was available and the exit rules were followed. Alerts without an explicit entry, exit, or time limit are difficult to score fairly because there’s no consistent way to determine when the signal became actionable or finished.
Accuracy, Win Rate, and Return Are Different Metrics
Win rate is the number of winning outcomes divided by all eligible, resolved alerts, expressed as a percentage. Define how expiration and missing data are handled, and report excluded or unresolved alerts separately. Otherwise, the denominator can quietly change the result.
Returns depend on more than the share of winning alerts. Position size, average gain, average loss, and trading costs all affect the outcome. A system can win often yet lose overall if its losing trades are larger. A lower win rate can still accompany positive returns when gains outweigh losses. Win rate describes how often alerts win, not the size of their payoffs.
Historical accuracy is evidence about recorded outcomes under a particular test, not certainty about future signals. Market conditions can change, and historical testing can overfit past data. Reviewing historical backtesting methodology helps explain why test assumptions and data selection matter. Treat accuracy as one research input, then examine the rules, sample, and risk context behind the score.
How to Measure Stock Alert Accuracy Step by Step
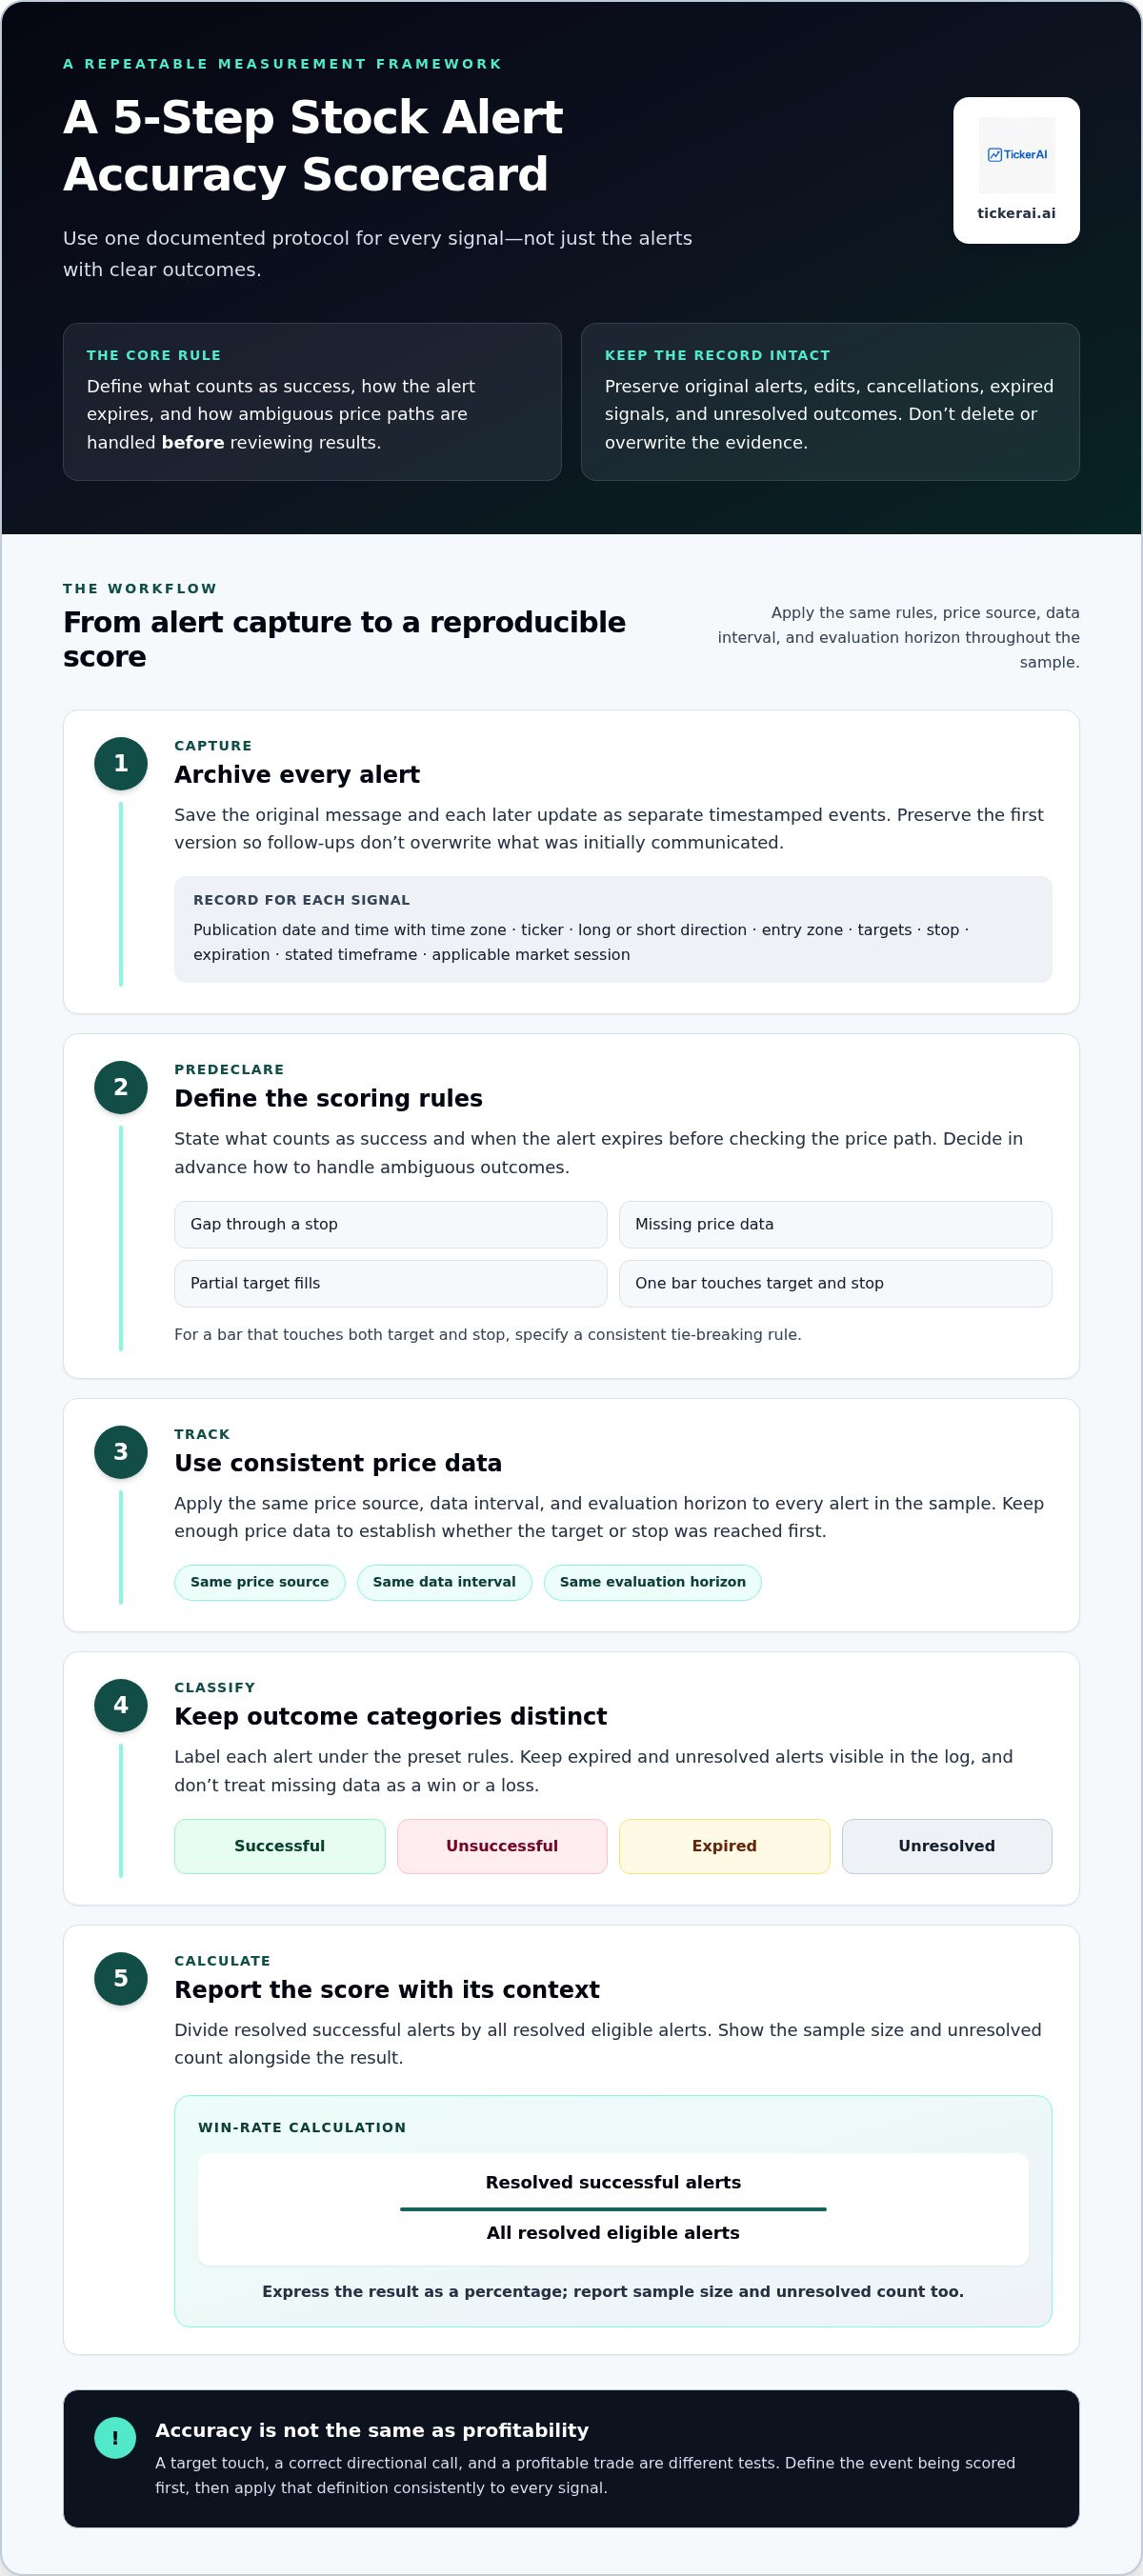
A repeatable score starts with a complete record, not a highlight reel. To learn how to measure stock alert accuracy, apply one protocol to every signal, including alerts that expire, are edited, or never reach a target. Keep the raw record and scoring rules together so another reviewer can reproduce the result.
Create a Complete, Time-Stamped Alert Log
Capture each alert when it appears. Record the publication date and time with time zone, ticker, long or short direction, entry zone, targets, stop, expiration, stated timeframe, and applicable market session. Save edits, cancellations, and follow-up messages as separate timestamped events. Preserve the original alert so a later update doesn’t overwrite what was first communicated.
Keep expired and unresolved alerts visible in the log. Mark their status instead of deleting them. This makes the sample auditable and prevents the record from quietly favoring signals with clear outcomes.
Apply the Same Five-Step Protocol
- Archive every alert. Save the original message and subsequent updates with their timestamps.
- Define the scoring rules. State what counts as success, how the alert expires, and how to resolve ambiguous price paths before reviewing results.
- Track prices consistently. Use the same price source, data interval, and evaluation horizon for every alert in the sample. Record enough price data to determine whether a target or stop was reached first.
- Classify each outcome. Label alerts as successful, unsuccessful, expired, or unresolved under the preset rules. Keep categories distinct; don’t treat missing data as a win or loss.
- Calculate the score. Divide resolved successful alerts by all resolved eligible alerts, then report the sample size and unresolved count alongside the result.
Set Outcome Rules Before Reviewing Results
Choose a test that fits the alert. Success might mean the target was reached before the stop, or that the position ended above its entry at expiration. These methods answer different questions, so don’t switch between them after seeing the price path. Define how to handle a gap through a stop, missing price data, partial target fills, and overlapping alerts. If a single price bar touches both target and stop, specify a consistent tie-breaking rule.
For example, evaluate an alert issued near the market open from its publication timestamp, not from an earlier price that day. A target touched after expiration doesn’t qualify if the rule requires a hit within the stated horizon. Keep the market session and price source consistent across the full sample.
Accuracy formula: Resolved successful alerts ÷ all resolved eligible alerts.
That percentage measures the defined outcome, not the full risk or return profile. For broader context on evaluating investment choices and risk, consult FINRA's investor education principles. Smart watchlists and real-time alerts, such as those available through TickerAI’s stock research tools, can provide research inputs to assess within this review process.
Which Metrics Make Stock Alert Comparisons Fair?
No single percentage captures alert quality. A fair scorecard pairs hit frequency with payoff size, downside exposure, and performance against a relevant benchmark. Before comparing systems, align the strategy type, holding period, market conditions, and asset universe. An intraday momentum alert for small-cap stocks shouldn’t be ranked directly against a long-term signal for large-cap shares without showing those differences.
| Metric | What it shows | What it misses alone |
|---|---|---|
| Win rate | Share of resolved alerts classified as wins | Size of wins and losses |
| Expectancy | Average expected gain or loss per outcome under stated assumptions | Order of results and drawdown severity |
| Maximum drawdown | Largest peak-to-trough decline in the tracked strategy | Whether returns beat a passive alternative |
| Benchmark-relative return | Strategy return compared with a relevant benchmark over the same period | Differences in risk or execution assumptions |
Why Win Rate Alone Can Mislead
Win rate counts winning outcomes, not how much each one gained or lost. Expectancy combines win frequency with average win and average loss: (win rate × average win) minus (loss rate × average loss). For illustration, assume each average win or loss is measured in normalized units, before costs. An 80% win rate with average losses 4.5 times average wins has negative expectancy. A 40% win rate with average wins 2.5 times average losses has positive expectancy. Neither hit rate is inherently good without its risk and payoff context.
Position sizing also changes portfolio-level results. A small position on a winning signal and a large position on a losing one can produce a different return profile from equal-sized trades, even when signal outcomes are identical.
Compare Like with Like, Including Benchmarks
Match alert types by timeframe, symbols or asset universe, and outcome rules before comparing metrics. Then disclose the benchmark, measurement dates, and return calculation. A broad-market index may be relevant for a diversified equity signal, while a narrower universe may call for a closer comparison. No benchmark is universally appropriate.
Show the sample size beside every summary statistic, along with the longest losing streak. Small samples can make a strong-looking win rate unstable. Losing streaks can also reveal sequence risk that an average hides.
Keep observed signal results separate from modeled trading returns. First report what the stated rules imply using the chosen price data. Then show any hypothetical assumptions for spread, slippage, commissions, or execution delay as a separate scenario, not as observed performance. This distinguishes results based on the signal from results that depend on assumed trading conditions. For a more useful view of how to measure stock alert accuracy, group results by strategy, holding period, market conditions, and asset universe, then compare each group using the same metric definitions.
How to Validate Results and Spot Misleading Accuracy Claims
A performance claim is only as useful as the evidence behind it. Apply the same audit to every published record, whether it reports live alerts or a historical simulation. When reviewing how to measure stock alert accuracy, focus on completeness, timestamps, scoring rules, and whether an independent reader could reproduce the result.
Audit the Data Behind a Performance Claim
Start with the record. A credible evaluation should let you trace each alert from publication to outcome, rather than relying on selected winning examples. Use this checklist:
- Completeness: Are losing, expired, cancelled, and unresolved alerts accounted for, with exclusions explained?
- Timestamps: Are alerts dated and timed clearly enough to match them to market prices available at that moment?
- Consistent rules: Were the same entry, target, stop, expiration, and tie-breaking criteria applied across the sample?
- Reproducibility: Can a reviewer follow the cited prices and scoring method to reach the same classifications?
- Sample context: Are the evaluation period, alert count, and any removed signals disclosed?
These checks help identify common forms of distortion without assuming intent. Selection bias can arise when a report includes only a chosen subset of alerts. Survivorship bias occurs if failed signals or symbols are absent while those that remain are counted. A cherry-picked time window may emphasize a favorable stretch and leave out less favorable periods. Each can make results look stronger than a complete, consistently scored history.
Account for Backtests, Slippage, and Market Context
Historical backtests and live alerts answer different questions. A backtest applies rules to past data, and its simulated fills may not match prices available in real time. Spreads, slippage, liquidity, and alert-to-execution delay can all affect a hypothetical trade result. A live record reflects actual signal timing, but still needs transparent outcome rules and complete logging.
Check whether a historical model could have used information that wasn’t available when the simulated signal occurred. That’s look-ahead bias. Data mining is another risk: testing many rule combinations on the same history can produce a strategy that fits that sample unusually well. Neither issue proves a result is invalid, but both make out-of-sample or forward results important context.
Compare performance across distinct market conditions and state the dates and method used for each comparison. Strong results in one environment don’t establish that the same pattern will persist. For a broader framework covering factors beyond accuracy, see evaluating an AI stock picking service.
Use the same audit discipline for AI-generated ideas and alerts. Explore TickerAI’s AI-powered stock research as a source of research inputs to assess against your own documented criteria, not as a substitute for validation.
Use Accuracy Data to Evaluate AI Stock Alerts
A useful accuracy score is a decision input, not a verdict. Pair it with four checks: consistency across review periods, transparency about how results were produced, fit with your strategy and holding period, and risk context such as drawdowns or losing streaks. A single aggregate score can conceal meaningful differences between alert types.
Use this checklist when reviewing AI stock alerts:
- Consistency: Do comparable signals produce comparable results under the same scoring rules?
- Transparency: Can you understand the signal’s basis and the assumptions behind reported results?
- Fit: Does the alert type and timeframe match the approach you’re evaluating?
- Risk context: Do the results show downside exposure as well as wins?
When interpreting AI stock signals, treat a model-generated idea as a prompt for further research. Accuracy figures describe past observations under stated conditions. They don’t establish that a future signal will behave the same way.
Build a Repeatable Review Cycle
Choose a fixed sample for each review and retain the same outcome definitions. Track results by signal type and timeframe instead of blending intraday alerts, swing setups, and longer-horizon ideas into one score. Keep a dated record of changes to scoring rules, data sources, or alert processes. That change log helps explain whether a later result reflects different signals or a different measurement method.
Smart watchlists and real-time alerts can support this workflow by helping organize the research inputs you review. Use them to capture and categorize ideas, then apply your documented criteria consistently. Automated stock market analysis can help scale research, but each idea still needs the same documented review.
Where TickerAI Fits in an Evidence-Led Workflow
TickerAI provides AI-powered stock opportunity discovery, smart watchlists, real-time alerts, curated swing trade setups, and long-term investment ideas through its Pro and Full-Access subscriptions. These are research inputs to evaluate within your own measurement process, not a promise of accuracy or a substitute for independent judgment. Apply your rules, assess the risks, and decide whether each idea fits your research objectives.
For a disciplined review, log signals as they arrive, group them by type and timeframe, and revisit the same metrics at regular intervals. This keeps evaluation connected to alert records instead of broad claims alone. If you want to incorporate AI-powered discovery into your research workflow, explore TickerAI’s stock discovery platform as a research tool, not a performance guarantee.
Make Your Next Alert Review More Deliberate
Change your scorecard only when your research process changes. If you revise an evaluation rule, note when and why, then treat results under the new method as a separate record. That keeps future comparisons useful and helps you avoid mistaking a change in measurement for a change in signal quality.
Knowing how to measure stock alert accuracy gives you a stronger basis for assessing ideas, but the next step is applying that discipline consistently. Use AI discovery to surface research opportunities, then bring your own criteria and risk judgment to each decision.
Explore TickerAI’s AI-powered stock opportunity discovery, smart watchlists and real-time alerts, curated swing trade setups, and long-term investment ideas as inputs for a research process you control. Review each alert against clear criteria and keep your decisions grounded in your own assessment.
Frequently Asked Questions
What is a good stock alert accuracy rate?
There’s no universal accuracy rate that makes a stock alert service good. The figure depends on the success rule, strategy timeframe, and relationship between average wins and losses. Frequent small gains, for example, may be outweighed by a rare, much larger loss. Review hit rate alongside expectancy, drawdown, sample size, and benchmark results. The useful question isn’t whether a percentage looks high, but whether the full record fits your risk and research criteria.
How many stock alerts do I need to measure accuracy reliably?
No alert count guarantees a reliable conclusion. A complete record across varied market conditions is more informative than a few memorable examples, but results remain uncertain, especially in a small sample. Report the number of resolved alerts and consider showing an uncertainty range around the rate instead of presenting it as exact. If the sample covers only one market phase or signal type, treat the finding as preliminary, not a forecast of future performance.
Can a stock alert count as accurate if the price reaches its target later?
Only if the alert’s scoring rules allow the target to be reached within that period. Set the evaluation window before reviewing price movements. For instance, if a signal expires at Friday’s close, a target touched the following Monday falls outside that test. Also distinguish an intraday price touch from a closing price above the target. The chosen rule should match the alert’s stated objective and remain consistent across the signals you compare.
Should I count cancelled or expired stock alerts in the accuracy rate?
Keep both in the audit trail, then apply a disclosed rule established before scoring. A cancellation might be excluded from resolved outcomes if it was issued before the signal became actionable and that treatment was defined in advance. An expired alert should remain visible even if it never reached its target or stop. Report cancelled, expired, unresolved, and excluded counts separately so the accuracy denominator is clear and reviewable.
Is stock alert accuracy the same as investment return?
No. Accuracy counts how often alerts meet a selected condition; return measures the result of a defined trading approach. A directional alert, for example, may correctly predict a rise, but the move could be too small to offset transaction costs or a prior loss. Position size and exit timing also shape returns. Keep signal outcomes separate from portfolio performance, and state the assumptions behind any return calculation.
How often should I recalculate stock alert accuracy?
Choose a review cadence that matches how quickly the alerts are expected to resolve, then keep it stable instead of reacting to each short streak. A swing signal and a long-term idea won’t mature on the same schedule, so review them in separate groups. Keep rolling-period results alongside the full-period record. That lets you notice possible changes without losing the broader history or over-weighting a brief run of wins or losses.
Are AI stock alerts guaranteed to be accurate?
No. AI-generated alerts can’t guarantee a particular price movement or trading result. They’re research signals, and market conditions can shift or invalidate the assumptions behind a setup. Use historical results to understand how signals behaved under defined conditions, not as a promise about the next alert. Combine that evidence with your own research and risk tolerance before making decisions. Past accuracy can inform a review, but it can’t remove uncertainty from markets.


