

Most traders treat AI alerts like a magic crystal ball. The reality is far more clinical. An AI signal is a statistical anomaly, not a guaranteed profit. If you're struggling with information overload or the fear of false positive alerts, you're likely missing the bridge between raw data and trade execution. Learning how to interpret AI stock signals is the difference between chasing noise and capturing alpha. It's about moving from a passive observer to a precise executor in a market that moves at the speed of an algorithm.
We understand the friction of manual scanning and the difficulty of timing entries in volatile markets. You need a system that filters the chaos. This guide provides a professional framework to transform algorithmic discovery into high-probability swing trade setups. You'll master a repeatable workflow for validating alerts and reducing the time spent on manual watchlists. We'll examine the technical logic behind these signals and how to verify them against market mechanics. Expect a streamlined approach to building confidence in every trade you take.
Key Takeaways
- Identify the logic behind multi-factor alerts. Modern AI models process complex data sets to find mathematical anomalies that traditional technical indicators often overlook.
- Master how to interpret AI stock signals by decoding metadata. Analyze trigger types and institutional volume flows to separate high-conviction opportunities from market noise.
- Apply contextual filters to every discovery. Cross-reference automated alerts with broader sector rotation analysis to ensure your trade aligns with the current market regime.
- Standardize your execution workflow. Transform raw algorithmic data into actionable swing trade setups by defining precise entry confluences and risk-adjusted position sizes.
The Anatomy of an AI Stock Signal: Beyond the 'Buy' Alert
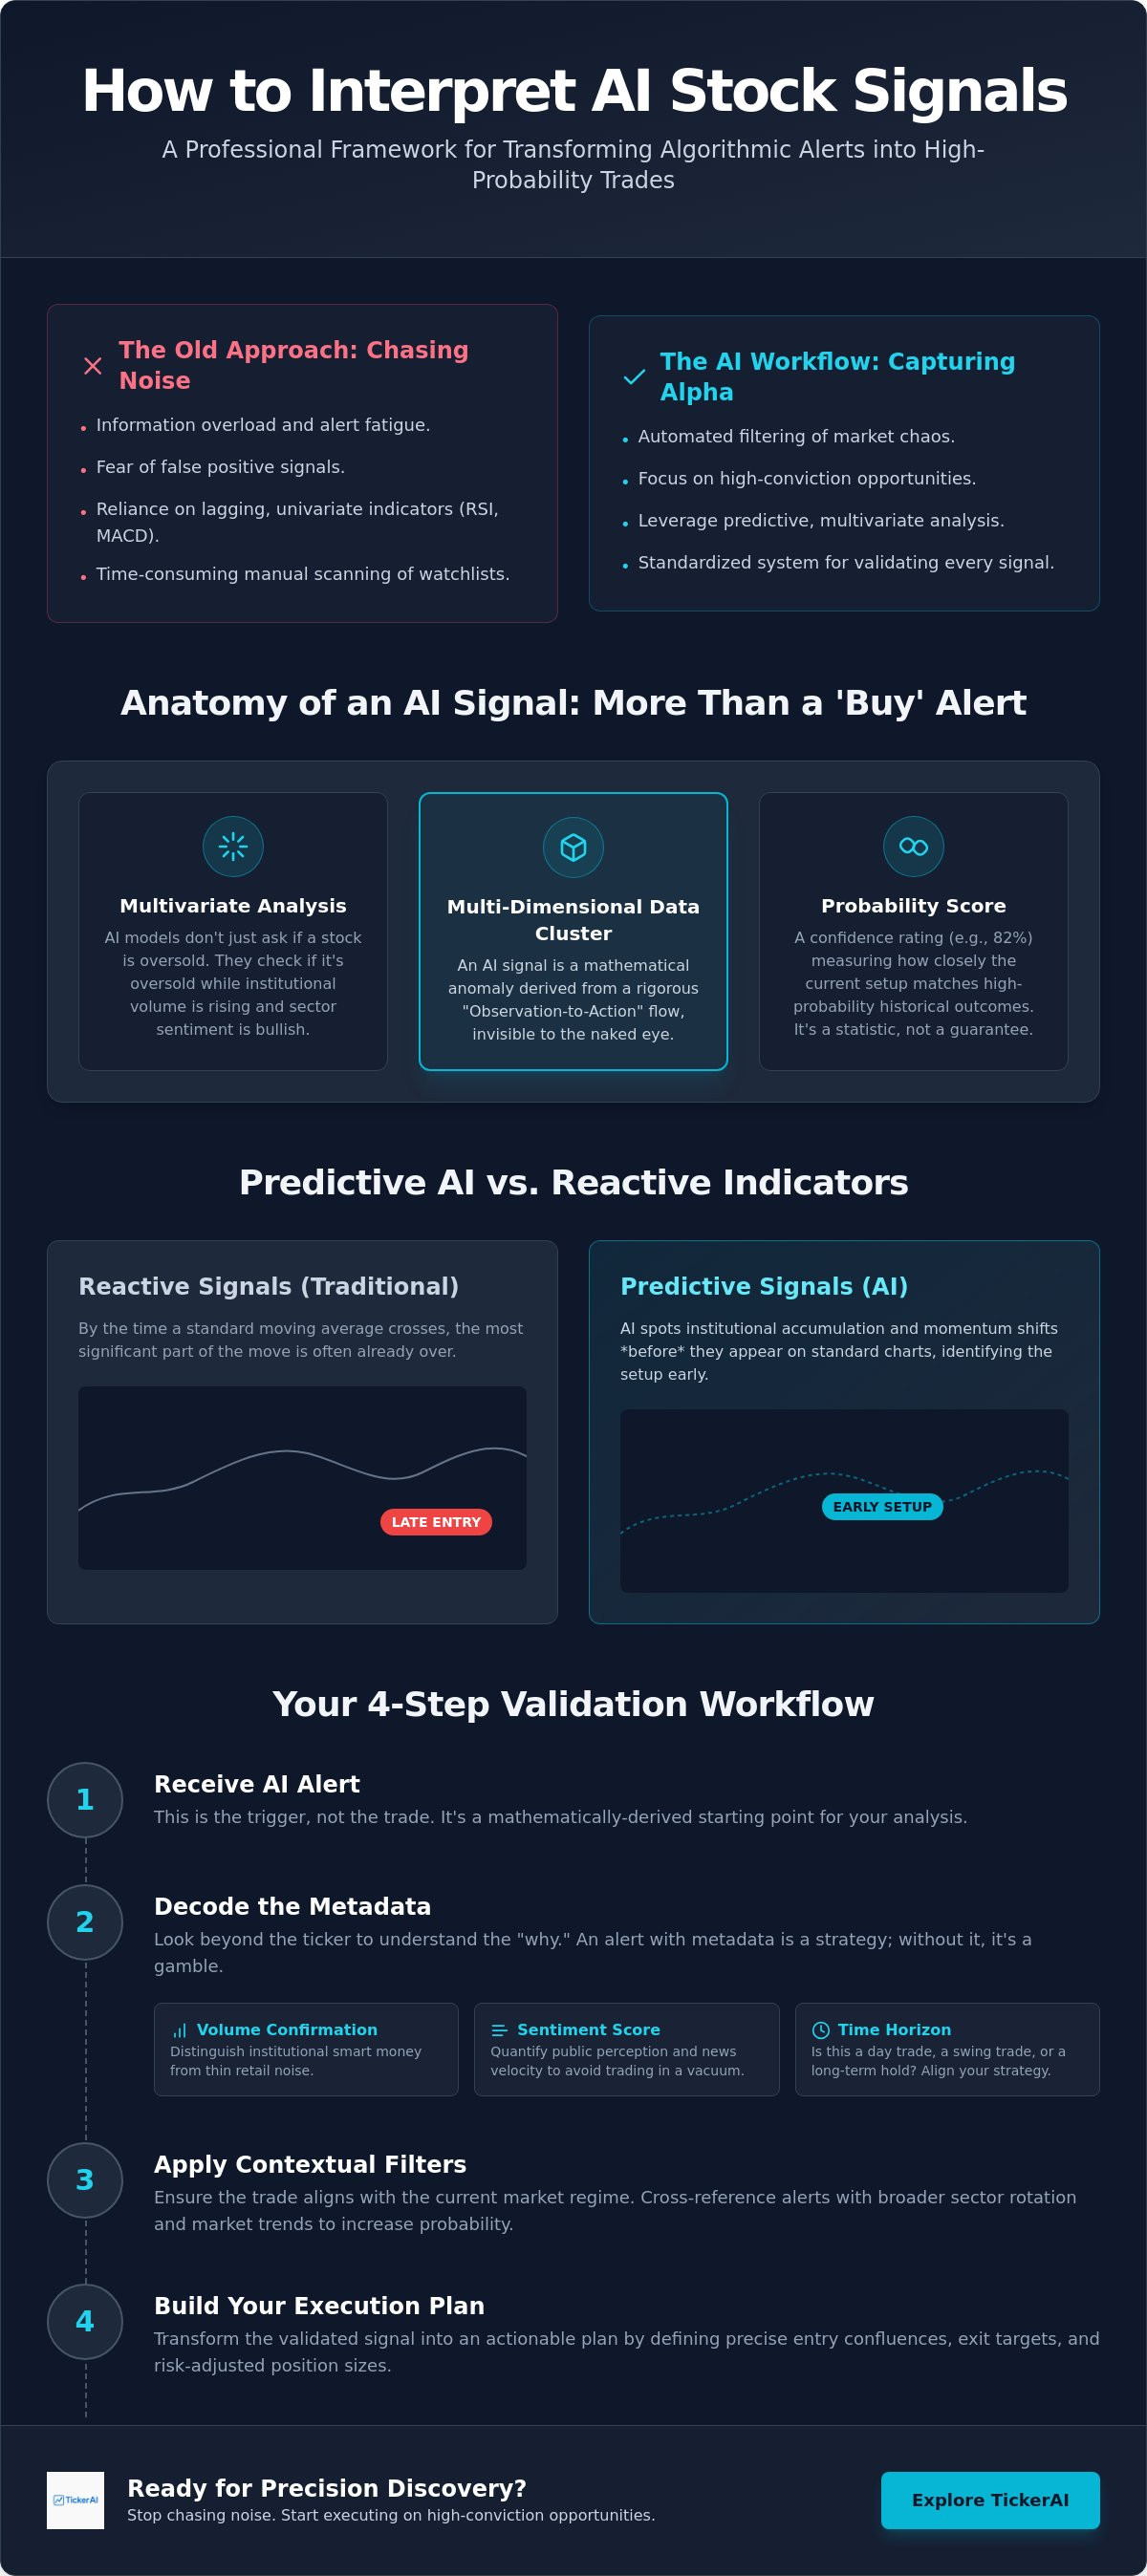
An AI stock signal is not a suggestion. It's a mathematically-derived alert triggered by specific, weighted algorithmic parameters. While a human trader might look at a chart and see a potential breakout, an AI sees a multi-dimensional data cluster. It identifies anomalies that are invisible to the naked eye. Mastering how to interpret AI stock signals requires moving beyond the basic buy notification. You must understand the structural logic of the alert. These signals are the result of a rigorous "Observation-to-Action" flow. Raw data is ingested, filtered for noise, and prioritized based on historical probability.
Traditional technical indicators like RSI or MACD are univariate. They're lagging. They tell you what already happened. AI models are multivariate. They don't just ask if a stock is oversold. They ask if it's oversold while institutional volume is rising, sector sentiment is bullish, and volatility is compressing. This synthesis creates a "probability score" or confidence rating. For instance, an AI platform might provide a signal for a ticker like Apple (AAPL) with an 82% confidence rating. This isn't a guarantee of profit. It's a measure of how closely the current setup matches high-probability historical outcomes.
Predictive vs. Reactive Signals
Reactive signals often lead to late entries. By the time a standard moving average crosses, the meat of the move is frequently gone. Predictive AI identifies momentum shifts before they appear on standard charts. It uses sophisticated pattern recognition to spot institutional accumulation. This involves tracking the footprints of smart money through micro-fluctuations in order flow. For a deeper look at these mechanics, this algorithmic trading overview provides the foundational context of how machines interact with market liquidity. AI finds the setup while the retail crowd is still looking at yesterday's indicators.
The Role of Data Confluence
Confluence is the core of signal strength. Professional AI platforms often cross-reference over 95 data sources at once to generate a single alert. This systematic approach reduces the reliance on manual watchlists and gut feelings. The data processed usually falls into three categories:
- Technical inputs: Real-time price action, volume anomalies, and volatility clusters.
- Alternative data: Sentiment analysis from global news cycles and social media velocity.
- Fundamental triggers: Automated analysis of SEC filings and earnings surprises.
When these data points align, the system moves from simple monitoring to delivering a high-conviction alert. Understanding this anatomy is the first step toward building a repeatable workflow for validating every signal you receive.
Decoding Signal Parameters: How to Read the Metadata
A notification on your screen is only the starting point. To understand how to interpret AI stock signals at a professional level, you must look at the metadata accompanying the alert. This data reveals the "why" behind the trade. It identifies whether the primary trigger is a breakout, a mean reversion, or a catalyst-driven move. An alert without context is a gamble; an alert with metadata is a strategy. High-conviction discoveries include specific parameters that define the expected behavior of the ticker once the signal is live.
Volume confirmation is the most critical metadata point. It allows you to distinguish between retail noise and institutional "smart money" flow. Retail spikes are often thin and easily reversed. Institutional accumulation leaves a distinct footprint in the tape that AI can detect through order flow analysis. Sentiment scores add another layer of clarity. They quantify how public perception and news velocity impact short-term volatility. If a technical signal fires but the sentiment score is crashing, the probability of a "false positive" increases. Professional tools provide these layers to ensure you aren't trading in a vacuum. For those seeking transparency in how these algorithms are governed, the SEC guidance on robo-advisers highlights the importance of understanding the automated logic behind financial alerts.
Every signal has a defined time horizon. You must know if you are looking at a day trade, a swing trade, or a long-term investment idea. Misaligning your exit strategy with the signal’s intended duration is a common cause of avoidable losses. If the algorithm detects a three-day momentum burst, holding for three weeks ignores the statistical basis of the alert. Using TickerAI Full-Access can help you filter these time horizons to match your specific trading style and risk tolerance.
Momentum and Trend Strength
AI quantifies the strength of a move by measuring its acceleration against historical norms. Momentum velocity is the rate of change in price relative to historical volatility. This metric helps traders identify "exhaustion" signals. When velocity peaks too quickly, the probability of a sharp reversal increases. AI detects these cooling periods before the price actually turns, allowing you to secure profits while the retail crowd is still buying the top.
Support and Resistance Intelligence
Manual charting often misses "hidden" liquidity zones where large blocks of shares are waiting to be filled. Algorithmic discovery identifies these areas by analyzing depth-of-book data and historical volume profiles. It differentiates between "soft" resistance, which is likely to be breached on high volume, and "hard" resistance, where institutional selling is concentrated. Automated level detection provides the precision needed to set entries and stops that are backed by actual market liquidity rather than arbitrary lines on a screen.
Contextual Validation: Filtering Algorithmic Noise
The #1 rule for professional trading is simple. Never trade a signal in a vacuum. Even the most sophisticated algorithm cannot account for every external variable in real-time. To truly master how to interpret AI stock signals, you must apply a layer of contextual validation. This process filters out high-risk alerts and prioritizes setups with the highest probability of success. It's about ensuring the individual ticker's momentum aligns with the broader market's structural health. If you ignore the environment, you're just gambling on a data point.
Start with sector alignment. A bullish signal on a tech stock is significantly more reliable if the entire sector is showing strength. Check your discovery against an automated market sector rotation analysis to confirm you aren't fighting a macro trend. If the sector is underperforming, the signal is likely a bull trap. Similarly, you must identify upcoming catalysts. Using AI for tracking stock catalyst events allows you to avoid 'earnings traps' where a technical breakout is immediately crushed by a fundamental news release. Understanding the market regime is equally vital. Some algorithms excel in trending environments but fail in choppy, range-bound markets. Identify the regime first. Validate the signal second.
The Macro Overlay
Assess the "Market Breadth" before committing capital. Are the majority of stocks moving in the same direction as your signal? A breakout on low breadth is often a sign of exhaustion. Macro data points also dictate algorithmic reliability. Interest rate decisions and CPI releases can trigger massive volatility that overrides technical setups. A top-down approach ensures you're trading with the wind at your back. Observe the macro trend. Filter for sector strength. Execute on the stock alert. This sequence reduces the noise of individual fluctuations.
Spotting False Positives
False positives are part of the game. Your goal is to minimize their impact. Watch for low-float traps where thin liquidity creates artificial price spikes. These are often driven by 'pump' sentiment anomalies rather than institutional buying. Over-extended stocks are another common red flag. If a ticker is already up 20% in two days, an AI breakout signal might be catching the very end of the move. Use the '3-Bar Rule' for confirmation. Wait for three consecutive candles to close in the direction of the trend shift before entering. This simple validation step drastically reduces the risk of buying a peak. Precision requires patience.
From Signal to Execution: Building Your Trading Plan
Validation is the filter, but execution is the engine. Developing a workflow for how to interpret AI stock signals is incomplete without a structured plan to manage the trade once it's live. Professional traders don't react; they execute. Your plan must be modular, allowing you to adapt to real-time volatility while maintaining strict risk parameters. Move from raw data to a high-probability swing trade setup by following a clinical five-step process.
- Step 1: Define Entry Criteria. Don't chase the price. Wait for the ticker to enter the confluence zone identified by the AI's technical and sentiment metadata.
- Step 2: Calculate Position Sizing. Determine your risk-per-trade. Use the distance between your entry and stop-loss to ensure no single signal can compromise your portfolio.
- Step 3: Set Automated Stop-Loss Orders. Use the "hard" support levels identified by the algorithm. Automated stops remove emotional bias during sudden market flushes.
- Step 4: Establish Tiered Profit Targets. Capture momentum swings by selling in stages. This locks in gains while allowing a "runner" to capture extended moves.
- Step 5: Log and Analyze. Record the signal's confidence score and your validation steps. This creates a feedback loop to refine your interpretation skills over time.
Risk Management for AI Alerts
Fixed percentage stops are a trap in algorithmic trading. High-volatility AI setups require dynamic stops that breathe with the market. Use Average True Range (ATR) to set your stops. If the ATR is high, widen your stop and reduce your position size to keep your dollar-risk constant. Focus on the R-Multiple concept. If a signal's potential reward isn't at least twice the risk (2R), the trade isn't worth the capital allocation. Precision in discovery requires equal precision in protection. Get started with TickerAI Pro to access real-time risk-adjusted alerts today.
Optimizing Exit Strategies
Riding a momentum wave requires trailing stops. As the price hits your first target, move your stop to break even. This transforms a successful setup into a "risk-free" trade. Watch for Signal Decay during the hold. Signal decay is the point where price action deviates from the algorithm's predicted path. If the AI logic was based on a three-day breakout and the stock begins to consolidate sideways for five days, the original signal has decayed. Exit the position. Don't marry the trade when the data changes. Adaptive execution ensures you keep the profits the algorithm found for you.
TickerAI: Precision Discovery for Professional Traders
Mastering how to interpret AI stock signals is a manual burden unless you leverage a platform built for prioritization. TickerAI acts as your proactive scout in a chaotic market. It doesn't just scan; it filters. By applying the multi-factor logic discussed in previous sections, the platform strips away the retail noise. This ensures that every alert hitting your dashboard is a high-conviction opportunity backed by mathematical confluence. You aren't just getting a ticker; you're getting a prioritized lead that has already passed through a rigorous algorithmic filter.
The platform offers two distinct tiers to match your trading intensity. The TickerAI Pro Subscription is designed for traders who need consistent, high-quality swing trade setups with clear logical backing. For those who require the deep metadata layers we've explored, such as institutional volume tracking and sentiment velocity, the TickerAI Full‑Access Subscription provides the complete intelligence suite. This includes the granular data points necessary for professional-grade validation and execution. Choosing the right tier allows you to align the platform’s speed with your specific risk tolerance and capital goals.
Organization is the key to efficient execution. TickerAI utilizes Smart Watchlists to categorize discoveries by theme, sector, or strategy. Instead of a single, overwhelming list, you can monitor specific market pockets like "High-Relative Volume Breakouts" or "Sector Rotation Leaders." Real-time alerts deliver this institutional-grade intelligence directly to your mobile or desktop. This removes the need to sit in front of charts all day. The system is always "on," detecting momentum shifts while you focus on high-level decision-making.
The TickerAI Edge
The core value of TickerAI is reclaimed time. Manual market scanning is a legacy process that often results in late entries. TickerAI automates this discovery phase, providing curated swing trade setups that are ready for validation. It isn't just about the technology; it's about the systematic growth that comes from data-driven consistency. By joining a community of serious participants, you move away from speculative "gut" trades toward a clinical, repeatable workflow. The platform handles the data processing so you can handle the execution.
Getting Started with Algorithmic Alpha
Setting up your first Smart Watchlist takes less than two minutes. You can customize your alert thresholds to ensure you only receive signals that meet your specific criteria for trend strength or volatility. This customization prevents the "alert fatigue" that often plagues less sophisticated tools. Once your thresholds are set, the system begins scanning 95+ data sources to find your next setup. It’s time to stop chasing the market and start anticipating it. Start your journey toward data-driven investing with TickerAI and transform how you interact with market data.
Capitalize on Algorithmic Precision
Trading is no longer about who has the most time to scan charts. It's about who has the most efficient filter. You've learned that mastering how to interpret AI stock signals requires a clinical approach to metadata and contextual validation. By moving from reactive observation to proactive execution, you transform raw data into high-probability swing trade setups. The noise of the market is constant. Your ability to filter it is your primary competitive advantage. Consistency isn't found in a single alert; it's found in a repeatable, data-driven workflow.
Institutional-grade algorithmic scanning is no longer reserved for the big players. You can now access real-time alerts for swing trade setups and utilize smart watchlists for thematic investing. This shift allows you to focus on decision-making while the machine handles the heavy lifting of discovery. Precision is a choice. Efficiency is a requirement in a fast-moving environment. The tools are ready. The data is live. It's time to trade with the speed and clarity of a professional.
Unlock Professional-Grade AI Stock Discovery with TickerAI
The market doesn't wait for manual watchlists to catch up. Take control of your discovery process and start trading with confidence today.
Frequently Asked Questions
What exactly is an AI stock signal?
An AI stock signal is a mathematically-derived alert generated by multi-factor algorithmic models. Unlike a basic price alert, it represents a synthesis of diverse data points including price action, institutional volume, and sentiment velocity. These signals identify high-probability anomalies where current market conditions match historical patterns of success. It's a prioritized lead designed to move you from raw data to an actionable trade setup with clinical precision.
Are AI stock signals more accurate than traditional technical analysis?
AI signals are multivariate, meaning they analyze dozens of factors simultaneously. Traditional technical analysis often relies on univariate, lagging indicators like RSI or MACD which only tell you what already happened. Modern AI platforms can cross-reference over 95 data sources to generate a single alert. This reduces the noise inherent in manual charting and provides a more comprehensive view of market mechanics, focusing on mathematical probability rather than just historical price levels.
How do I know if an AI signal is a 'false positive'?
Validation is the most critical step in how to interpret AI stock signals effectively. A signal is likely a false positive if it fires in a vacuum without sector alignment or during low-float liquidity traps. You should verify the signal against broader market breadth and check for upcoming catalysts like earnings. If the ticker is over-extended or the sector is underperforming, the probability of a failed breakout increases significantly.
Do I need to be a quantitative programmer to use AI stock alerts?
No. Professional discovery tools are designed to translate complex algorithmic outputs into a streamlined, accessible interface. The platform handles the heavy lifting of data ingestion, pattern recognition, and risk-adjustment. You don't need to write code to benefit from high-speed intelligence. Your role is to act as the final filter, using the provided metadata to validate the setup and execute the trade according to your plan.
Can I use AI signals for long-term investing or only for day trading?
AI signals are applicable across multiple time horizons, from short-term momentum bursts to long-term investment ideas. The algorithms detect institutional accumulation and fundamental shifts that precede major price moves. You must evaluate the metadata of each alert to determine its intended duration. Whether you're looking for a three-day swing or a multi-month position, the underlying logic of algorithmic discovery remains consistent.
How much should I risk on a single AI-generated trade setup?
Risk management remains your responsibility. Standard professional practice is to risk no more than 1% to 2% of your total equity on a single setup. Use the AI-identified support levels to set a dynamic stop-loss based on the Average True Range (ATR). Calculate your position size so that your potential loss doesn't exceed your risk-per-trade limit. High confidence scores from an algorithm don't eliminate the need for strict capital preservation.
What is the best way to backtest an AI stock signal strategy?
Analyze the historical performance of specific signal triggers across different market regimes. Look for the "R-Multiple" of past alerts to ensure the potential reward consistently justifies the risk. A robust strategy should demonstrate resilience in both trending and range-bound environments. Tracking these metrics in a trade journal helps you refine your ability to interpret AI stock signals and build confidence in the algorithm's long-term hit rate.
Does TickerAI provide personal financial advice with its signals?
No. TickerAI is an intelligence platform, not a financial advisor. In alignment with FINRA Rule 2210, we provide data-driven market observations and algorithmic discovery tools. We don't offer personal financial advisory, custom trading coaching, or brokerage execution services. You're responsible for the final supervision of your trades and ensuring all actions align with your individual financial situation and risk tolerance.