

A disciplined process matters more than a clever market guess. Quantitative investing uses data, statistical analysis, and mathematical models to identify potential opportunities, shape portfolios, and manage risk. Building a quantitative investment strategy means turning those inputs into consistent rules for selecting investments and setting portfolio exposures.
Markets are complex, and a systematic approach can make decisions more objective by reducing the influence of emotion and bias. But a model is useful only when you understand its factors, assumptions, and risks.
This article explains how quantitative investing works, how factors such as value, size, and momentum can guide security selection, and how portfolio construction and diversification affect risk. It also covers why testing, trading costs, and changing market conditions matter when assessing a strategy.
Key Takeaways
- Start with a clear market thesis, then assess whether available data can support a testable investment signal.
- Evaluate how correlations, trading costs, and factor exposures affect portfolio risk and diversification.
- Compare value, size, and momentum signals across market conditions before deciding how they fit your objectives.
- Use systematic tools to surface stock opportunities and organize watchlists, while treating signals as inputs to your own decisions.
What is Quantitative Investing?
Quantitative investing applies statistical models and data analysis to identify opportunities and manage risk. Building a quantitative investment strategy starts with a testable thesis, then evaluates its signals across different market conditions.
Identifying Market Opportunities
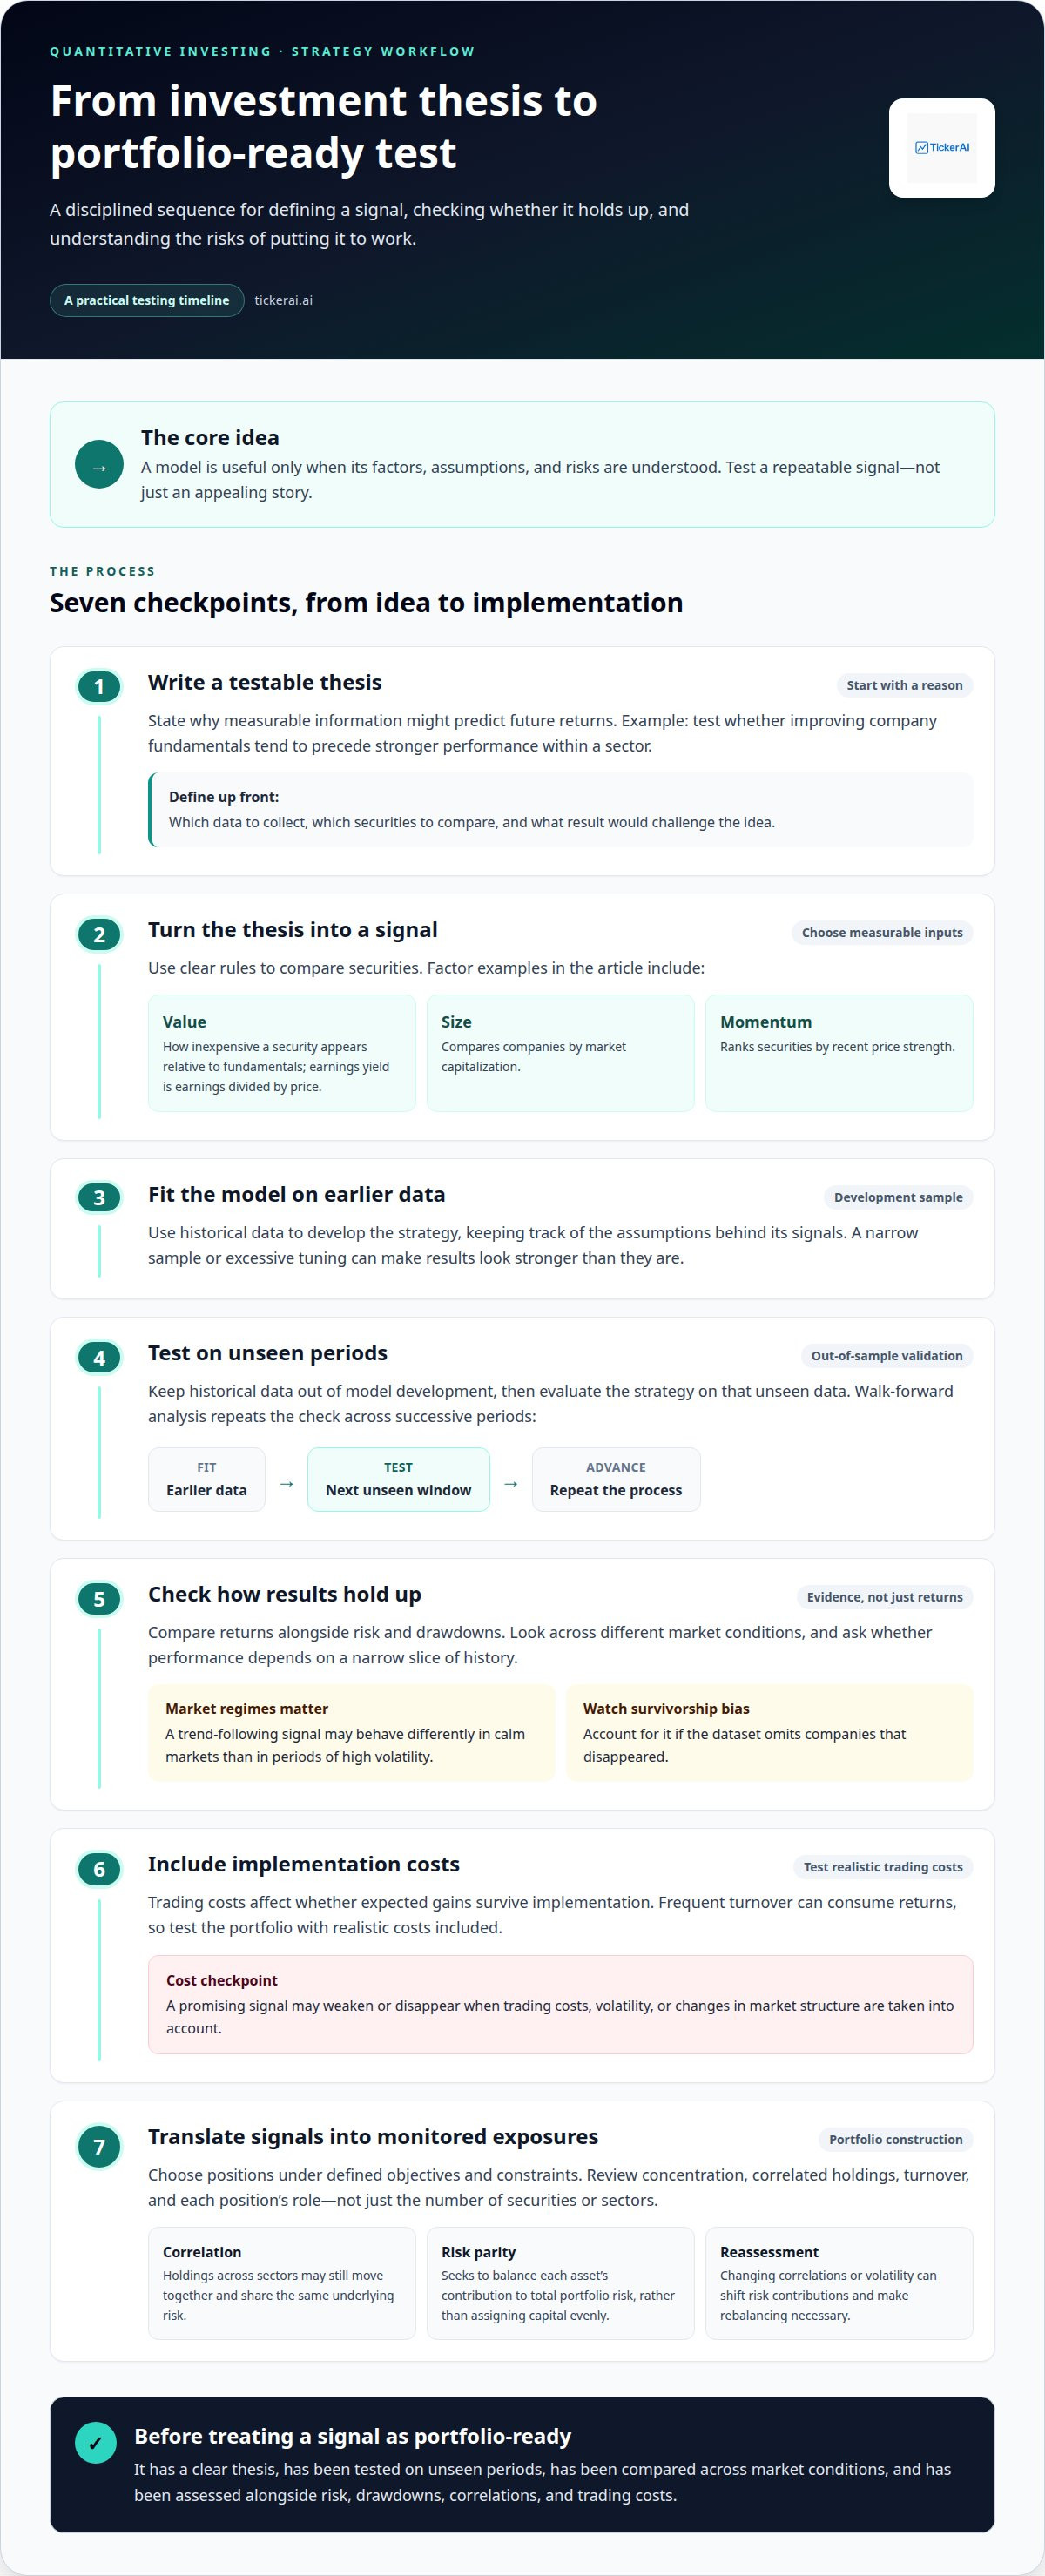
An investment thesis explains why measurable information might predict a security’s future returns. For example, an analyst might test whether improving company fundamentals tend to precede stronger performance within a sector. The thesis defines what data to collect, which securities to compare, and what results could challenge the idea. Clear criteria help distinguish a repeatable signal from an appealing story.
Market Inefficiencies and Statistical Arbitrage
Statistical arbitrage uses quantitative techniques to identify pricing relationships that appear temporarily inconsistent. A model might compare related securities and flag a shift in their historical relationship as a potential opportunity to investigate. The strategy depends on evidence that the relationship can recur, not simply on a price gap. Trading costs, changes in market structure, and volatility can weaken or erase an apparent inefficiency.
Analyzing Sectors and Market Conditions
Sector analysis compares companies using relevant financial data and tracks how trends differ across industries. A quantitative model can assess earnings, prices, or other available indicators, while economic events may change the context behind those signals. Market regimes matter too: a trend-following signal may behave differently in calm markets than in periods of high volatility. The Federal Reserve Board identifies company greenhouse-gas disclosures as one input for assessing portfolio carbon footprints.
Validating Strategies Out of Sample
Out-of-sample testing evaluates a strategy using historical data excluded from its development. Walk-forward analysis repeats the process across successive periods: fit the model on earlier data, test it on the next unseen window, then advance the window. This helps show whether results depend on a narrow sample or excessive tuning. Compare returns with risk and drawdowns, and account for survivorship bias if the dataset omits companies that disappeared.
Portfolio construction and diversification
Portfolio construction turns investment signals into positions, balancing expected returns against concentration, risk, and implementation constraints. Allocation matters as much as security selection: related holdings can expose a portfolio to the same underlying market move.
Portfolio Optimization and Risk Analytics
Portfolio optimization uses models to choose exposures under defined objectives and constraints, while risk analytics measures how those exposures may interact. Together, they help investors weigh potential return drivers against concentration and drawdown risks. For example, holding securities across sectors does not necessarily diversify a portfolio if their returns move together. Correlation analysis can reveal overlapping risks before capital is allocated.
Risk parity offers another allocation method. Instead of assigning capital evenly, it seeks to balance each asset’s contribution to total portfolio risk. This matters because assets with different volatility can affect overall risk unequally, even when their dollar allocations match. The method still requires monitoring: changing correlations or volatility can shift risk contributions and make rebalancing necessary.
Active ETFs can also be part of a portfolio’s implementation. Assess their holdings and allocation approach alongside the portfolio’s existing exposures, rather than treating an ETF as diversification by label alone. Examine the underlying assets, factor tilts, and sector concentrations. This helps show whether an ETF adds a distinct return driver or duplicates risks already present.
Portfolio Risk Models and Trading Costs
Portfolio risk models estimate how assets and strategies interact, including their correlations and potential contribution to overall losses. These estimates inform position sizing and diversification decisions, but depend on the data and assumptions used. Trading costs also affect whether expected gains can survive implementation. Frequent turnover can consume returns, so test the portfolio with realistic costs included.
Before implementation, compare the proposed allocation with its intended risk profile. Review concentration, correlated holdings, turnover, and the role of each position. If you’re screening for possible investments to assess within that process, AI stock opportunity discovery can help surface ideas for further analysis.
Factor investing, including value, size, and momentum
Factor investing ranks securities by measurable characteristics linked to potential returns. Factor selection and data analysis turn an investment thesis into rules that can be tested and incorporated into portfolio optimization.
Value, Momentum, Low-Volatility, and Quality Factors
Value measures whether a security appears inexpensive relative to fundamentals; earnings yield is earnings divided by price. Size compares companies by market capitalization, while momentum ranks securities by recent price strength. Low volatility targets assets with less variable returns, and quality evaluates characteristics such as financial strength. Each factor captures a different return driver, so combining signals can broaden an investment approach. For example, a model might rank companies by earnings yield, then assess momentum separately.
Historical Factor Performance
Historical factor analysis measures how a signal behaved across past securities and market periods. Compare returns, risk, and drawdowns, then test whether results persist across different conditions. A worked earnings-yield example scores a stock at 0.80 when its yield is 7%, against a 3% average and a 5% standard deviation.
Useful inputs include prices and returns, company fundamentals, institutional holdings, survey data, and unconventional sources. The Board of Governors of the Federal Reserve System describes a study using CRSP for prices and returns, COMPUSTAT for accounting data, and Thomson Reuters Institutional (13F) Holdings for institutional ownership. Data costs depend on access terms, coverage, and frequency. To limit survivorship bias, include companies that later disappeared; to avoid look-ahead bias, use only information available on each historical decision date.
Systematic Factor Investing Approaches
Systematic factor investing applies consistent rules to score securities and determine portfolio exposures. Investors can use a single factor, such as value, or combine value, momentum, low volatility, and quality in a composite ranking. Standardize inputs before combining them so one measure’s scale does not dominate the score. Then test factor behavior across market environments and align the weighting method with investment objectives and risk tolerance. Historical performance can inform selection, but past results do not establish future outcomes.
Benefits of quantitative investment strategies
A quantitative process turns investment criteria into repeatable decisions. For an equity strategy, explicit rules can rank companies by fundamentals or price behavior instead of relying on intuition alone. This structure helps investors understand why a security qualified and compare decisions consistently.
Systematic analysis can process broad datasets more consistently than manual review. A model can apply the same screening logic across sectors, flag changing signals, and help prioritize opportunities for further analysis. This makes data review more organized while keeping interpretation and risk decisions visible, rather than hidden in an instinctive trade.
Repeatability supports learning. Track each signal, portfolio exposure, and outcome, then compare results with the original thesis. If a historical pattern weakens, the record can prompt a review of the input data or assumptions. Improvement is not automatic, but a clear feedback loop helps test whether the approach still behaves as intended.
Quantitative methods can reduce the influence of human emotions and biases, especially when market volatility encourages reactive decisions. Predefined rules offer an alternative to changing plans after every market move. Yet models may not produce the intended results, and investment styles can fall out of favor or underperform comparable funds. Treat model outputs as structured evidence, not certainty.
For U.S. strategies, regulatory and tax considerations depend on what the strategy trades and how it is implemented. Review trading activity, recordkeeping, and tax reporting alongside model performance, since investment logic alone does not determine those obligations.
Use a systematic screen to generate candidates, then assess each against your objectives and risk limits. Explore long-term investment ideas as inputs for your own research and portfolio decisions.
TickerAI: AI Stock Opportunity Discovery
TickerAI helps investors surface potential opportunities when they want to turn a research framework into a focused watchlist. Its AI Stock Opportunity Discovery, Swing Trade Setups, and Long-Term Investment Ideas can provide candidates for analysis. Smart Watchlist & Alerts help organize securities and monitor market moves.
Use these ideas as inputs, not automatic portfolio decisions. Compare each candidate with your thesis, factor criteria, risk limits, and intended holding period. This keeps research connected to the rules you have established, whether you are assessing a short-term setup or a longer-term position.
Visit tickerai.ai to explore TickerAI’s investment research tools.
Turn your research process into a repeatable practice
The next step is to make your investment process observable. Define what would strengthen or weaken your thesis, record the signals behind each decision, and review whether your rules still match your objectives as conditions change. This discipline gives future adjustments a clear basis instead of letting short-term market noise dictate them.
Building a quantitative investment strategy is an ongoing process of refinement. Keep the model’s assumptions visible, measure outcomes against the intended risk profile, and treat new investment ideas as candidates for analysis rather than automatic decisions. A clear research workflow helps you stay focused while adapting thoughtfully.
For additional tools to support your research, explore TickerAI’s investment tools. Keep testing your assumptions and let evidence guide your next decision.
Frequently Asked Questions
What are the main steps to build a quantitative investment strategy?
Start by defining the investable universe and the market behavior you want to capture. Specify the data inputs and rules for turning them into signals. Next, set portfolio constraints, position-sizing logic, and rebalancing conditions. Test the complete process on data not used during development, with realistic trading assumptions. Finally, monitor live signals and compare them with the model’s expected behavior to identify drift or data problems.
How do you define an investment hypothesis and translate it into measurable signals?
State a testable reason an investment might behave differently, then identify observable evidence that could support or weaken it. For example, a hypothesis about improving earnings could use changes in reported fundamentals as a signal. Define eligible securities, data timing, comparison group, and holding rules before testing. This makes the thesis measurable and helps prevent subjective changes after you see the results.
Which statistical and machine learning methods are commonly used to build investment models?
Common approaches include linear or logistic regression, time-series models, and tree-based machine learning methods. Regression can estimate relationships between variables and returns; tree methods can capture nonlinear interactions. Clustering can group securities by similar characteristics, while regularization helps limit model complexity. Choose methods based on the question and data, then compare them with a simpler baseline to see whether added complexity improves out-of-sample performance in a useful way.
How do you backtest a quantitative strategy and account for transaction costs and slippage?
Simulate the rules using point-in-time data, applying each signal only after its inputs would have been available. Model transaction costs, bid-ask spreads, and slippage, the difference between an assumed execution price and the actual price. Include turnover and liquidity constraints because frequent or large trades can affect execution. Compare gross and net results, then review performance across different periods and market conditions.
What are common ways to measure strategy performance, risk, and drawdowns?
Assess returns alongside risk rather than relying on total profit alone. Useful measures include benchmark-relative returns, volatility, risk-adjusted performance, and maximum drawdown, the largest peak-to-trough decline. Win rate can provide context, but it does not show the size of gains and losses. Review these measures across separate periods and against the strategy’s stated objective to identify unstable performance or concentrated downside.
How do you size positions and manage portfolio risk in a quantitative strategy?
Position sizing translates a signal into an allocation while accounting for risk, liquidity, and portfolio constraints. A process might scale exposure using each security’s volatility, then limit concentration by sector or among correlated holdings. Review aggregate exposures as well as individual positions: several small holdings can still share one dominant risk. Rebalance when signals or risk estimates change, and include expected turnover in implementation decisions.


