

Your win rate is a vanity metric. If a service claims a high success percentage while your portfolio stagnates, you're likely capturing market beta instead of genuine alpha. Learning how to track performance of a stock alert subscription requires moving beyond simple profit and loss statements. It demands a clinical audit of your discovery-to-execution pipeline. You've likely experienced the frustration of information overload or watching theoretical gains disappear into slippage. It's difficult to distinguish between a skilled signal and a lucky break in a market where the Nasdaq Composite has grown 37.26% year-over-year.
This guide provides an institutional framework for auditing your alerts with professional precision. We'll move past surface-level data to focus on true performance attribution and execution discipline. You'll learn a repeatable workflow to isolate signal quality from broader market movements. By the end, you'll have the clear metrics needed to decide whether to renew or cancel. We'll examine slippage costs, benchmark against the current 9.01% S&P 500 YTD return, and establish a data-driven protocol for your trading desk.
Key Takeaways
- Log alert timestamps against actual entry prices to measure the precise impact of execution lag and slippage on your bottom line.
- Shift your focus to institutional metrics like Profit Factor and Expectancy to determine the mathematical edge of your subscription.
- Master how to track performance of a stock alert subscription by isolating signal alpha from broader market beta using the S&P 500 as a baseline.
- Establish a repeatable audit workflow that transforms raw alerts into a structured, searchable database of actionable performance data.
- Leverage professional tools like TickerAI Pro to access high-speed discovery signals designed for clinical execution and real-time auditing.
The Audit Mandate: Why Professional Performance Tracking is Non-Negotiable
Professional trading is an exercise in accountability. Most retail traders treat subscriptions as a "set and forget" engine for wealth. This is a fatal error. Knowing how to track performance of a stock alert subscription is the only way to distinguish between a legitimate edge and statistical noise. A service might claim a 30% annual return. If you can't enter the trade within seconds of the alert, your realized return might be negative. Your brokerage statement is the only truth that matters.
You must analyze the gap between "official" results and your actual fills. Official returns often ignore slippage, commissions, and the "liquidity trap" of low-float stocks. A bull market further complicates this audit. With the S&P 500 up 9.01% as of June 17, 2026, almost any long-biased strategy looks successful. Without proper investment performance metrics, you can't tell if you're paying for alpha or just riding high-beta market momentum. Professional auditing reveals if the subscription is actually beating the index or simply moving with the tide.
Divide your expenses into two distinct categories. The "Cost of Intelligence" is your fixed subscription fee. The "Cost of Execution" includes the price difference between the alert and your fill. Intelligence is your fixed overhead. Execution is your variable friction. If your execution lag consistently turns a "winning" alert into a break-even trade, the problem isn't just the signal; it's the infrastructure. You need to know if the subscription's delivery speed matches your broker's execution capabilities.
The Psychology of the Subscription Trap
Sunk cost fallacy is a primary driver of portfolio decay. Traders often stick with underperforming services simply because they paid for an annual TickerAI Pro Subscription. This leads to confirmation bias. You remember the one "10-bagger" while ignoring the twenty small losses that drained your account. Professional auditing breaks this loop. It forces you to look at the median outcome, not just the highlights. Establish a clinical, "always-on" monitoring mindset. If the data shows a negative expectancy over 30 trades, the subscription must be terminated.
Signal vs. Noise: The Professional Filter
High-conviction discovery is rare. Most alerts are speculative noise designed to keep users engaged. Professional tools focus on systematic opportunity discovery. They prioritize speed and technical parameters over vague advisory. TickerAI provides Smart Watchlist & Alerts and Swing Trade Setups that emphasize clear technical triggers. The goal is to reduce the discovery-to-action timeline. Every second saved is profit preserved. By focusing on data-driven discovery rather than "guru" advice, you remove the emotional variables that lead to poor execution. This shift transforms you from a passive follower into a proactive auditor of your own success.
Beyond Win Rates: Core Metrics for Stock Alert Performance Attribution
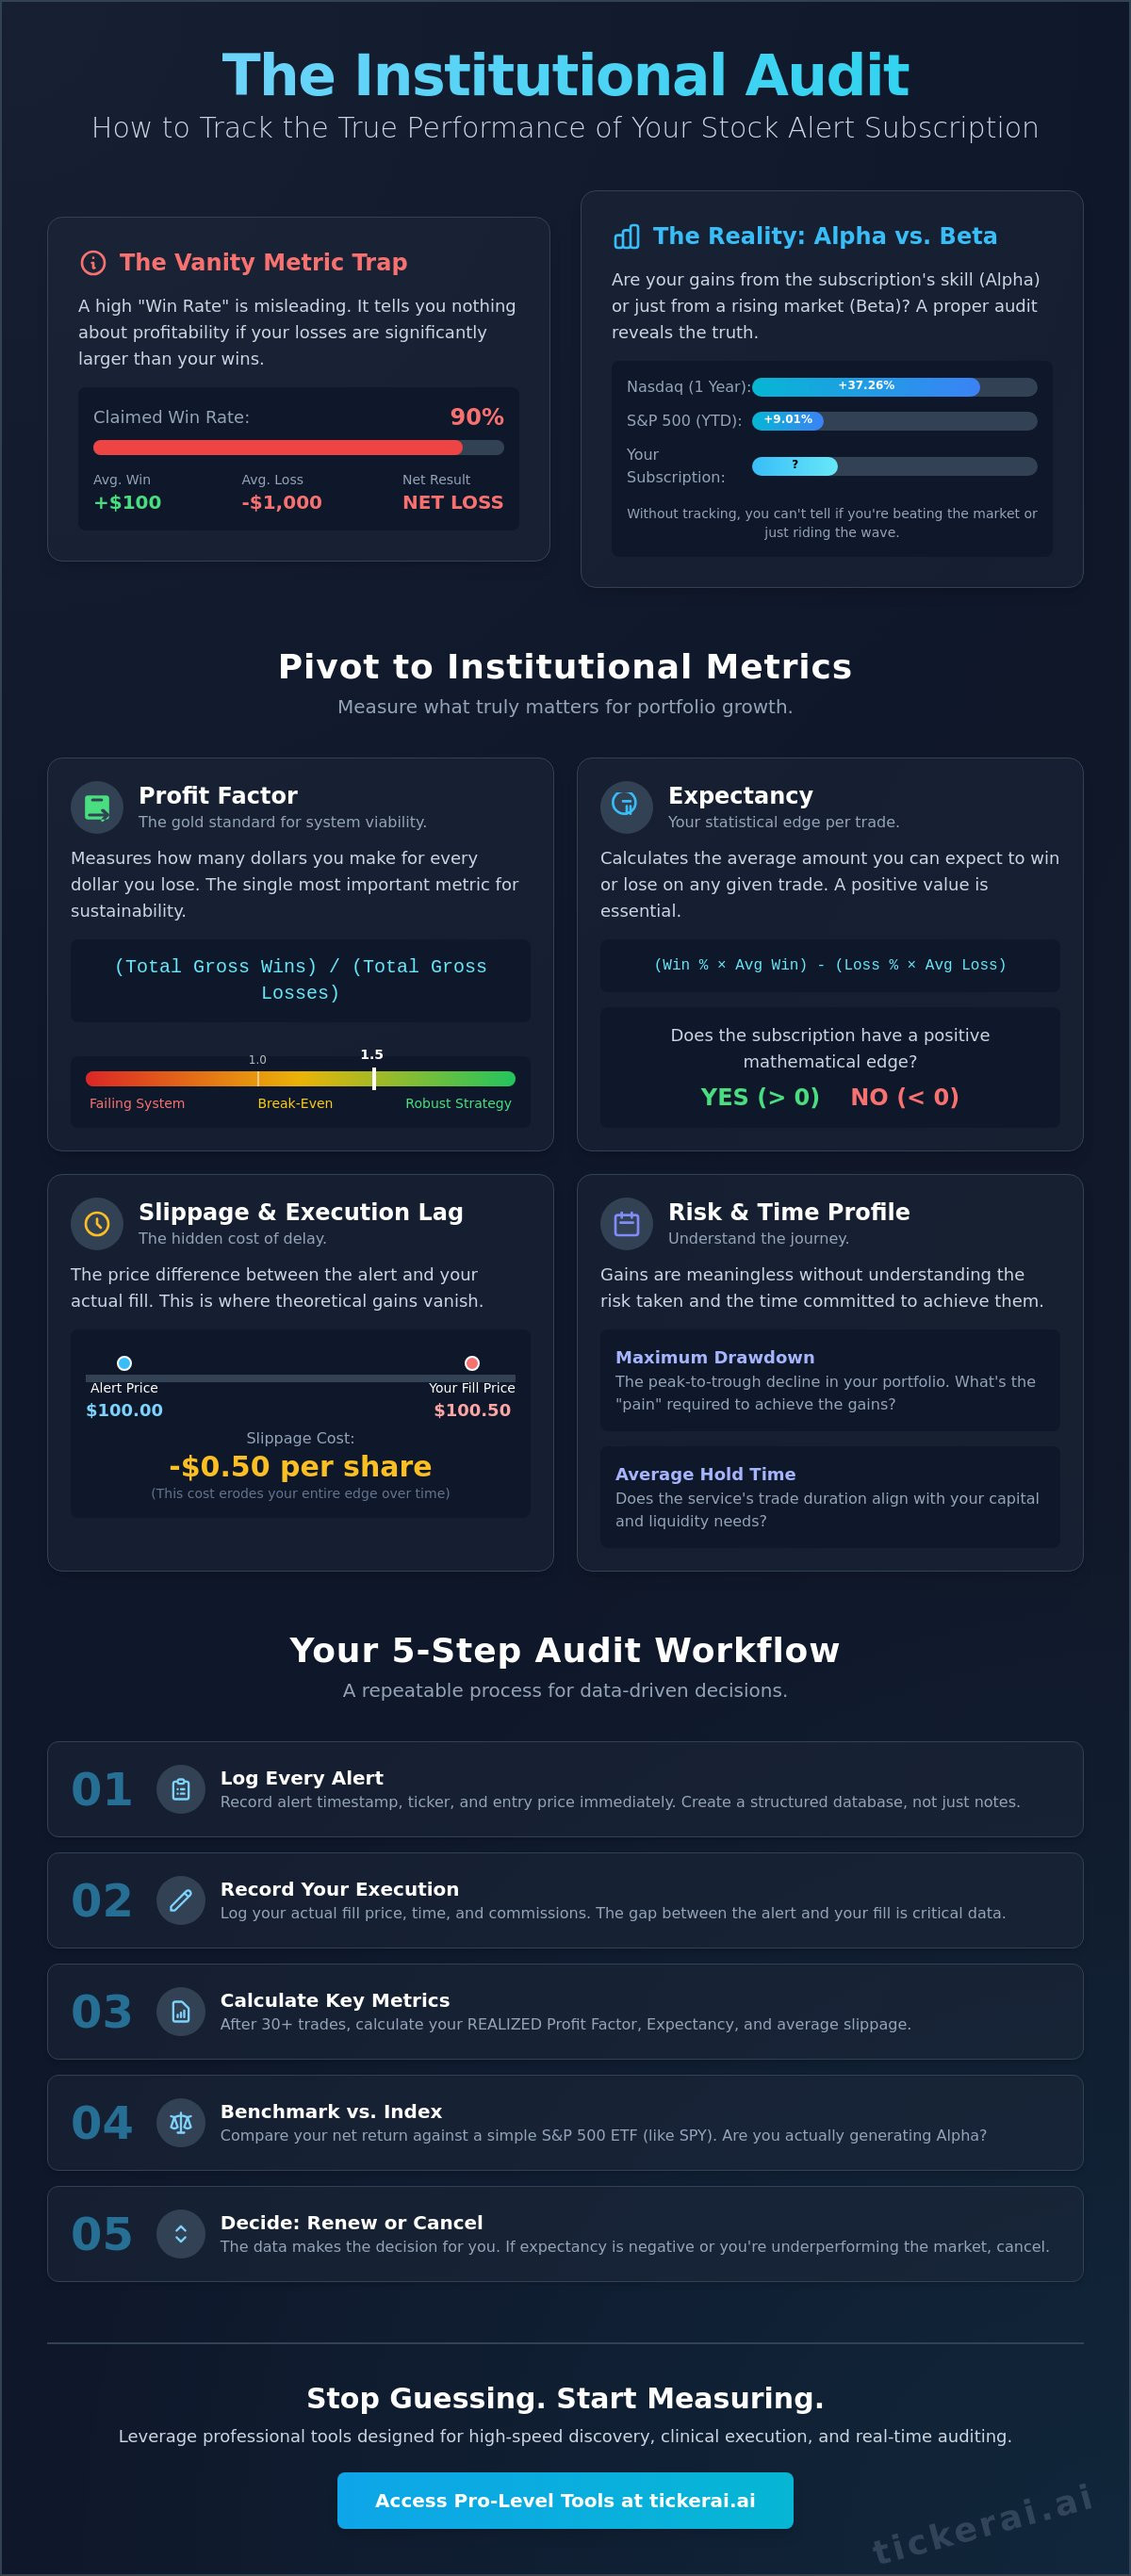
Win rate is a vanity metric. It feels good to see a high percentage of "green" trades, but this number tells you nothing about actual account growth. A 90% win rate is catastrophic if your average loss is ten times larger than your average win. To truly master how to track performance of a stock alert subscription, you must pivot to institutional metrics that account for risk, volume, and time. This shift moves you from being a gambler to an auditor of your own capital.
The Profit Factor is the institutional gold standard for this audit. Calculate it by dividing gross wins by gross losses. A profit factor above 1.5 suggests a robust strategy; anything below 1.0 is a failing system. This single number reveals if the alerts are generating sustainable wealth or simply churning your capital. You should also evaluate and monitor investment performance by measuring Maximum Drawdown. This identifies the "pain" required to achieve your gains. If a subscription requires a 20% drawdown to deliver a 10% return, the risk profile is likely unsustainable for your portfolio. Finally, monitor Average Hold Time. If a service alerts swing trades but the price action requires a three-month hold to reach targets, it may not align with your liquidity needs.
Calculating System Expectancy
Expectancy provides the definitive answer to whether a subscription has a statistical edge. Use the formula: (Win % * Average Win) - (Loss % * Average Loss). This calculation reveals the average dollar amount you expect to win or lose per alert. A 40% win rate can be highly profitable if your Reward-to-Risk (RR) ratio is 3:1 or higher. Expectancy is the only true measure of a trading edge in any market environment.
Risk-Adjusted Returns: The Sharpe Ratio for Subscriptions
Raw returns are meaningless without context. With the Nasdaq Composite up 10.3% year-to-date as of early June 2026, an alert service must do more than just follow the trend. When you analyze how to track performance of a stock alert subscription, you are essentially auditing the probability of future success based on historical risk distribution. High volatility in alert performance often signals flawed discovery logic or a lack of systematic filtering.
Consistent performance comes from identifying setups with historically tighter risk parameters. Tools like TickerAI Pro allow you to focus on high-speed discovery signals that prioritize these risk-adjusted metrics. By aligning alert performance with your specific average hold time and risk tolerance, you ensure the subscription serves your strategy rather than dictating it. Stop chasing the "big win" and start auditing the math.
Standardising the Log: A Systematic Workflow for Alert Tracking
Data without structure is noise. To understand how to track performance of a stock alert subscription, you must implement a rigorous logging protocol. Relying on your broker’s history is insufficient. Brokerage logs show what happened. A professional audit log shows what should have happened. This distinction is the foundation of institutional-grade performance analysis. Without a standardized workflow, you can't identify if losses are due to poor signal quality or your own execution friction.
Follow a five-step workflow for every alert received. First, record the "Alert Timestamp" and the "Alert Price" immediately upon receipt. This establishes the theoretical baseline. This timestamp is critical; it proves whether the service is front-running its own alerts or if the liquidity exists for real-world fills. Second, log your "Actual Entry Price" to calculate the delta between the signal and the fill. Third, categorize the alert by "Discovery Logic," such as momentum breakout, mean reversion, or gap-and-go. Not every logic works in every market regime. Fourth, audit the "Exit Logic" to determine if the trade ended via a hard stop-loss, a hit profit target, or a manual time-exit. Did you follow the plan, or did emotion override the data? Fifth, perform a weekly review to identify recurring patterns in execution gaps.
The Execution Gap: Measuring Slippage and Lag
Alpha Decay is the silent killer of retail portfolios. It's the erosion of potential profit that occurs between signal generation and order execution. If a stock alert triggers at $50.00 but you fill at $50.50, you've sacrificed 1% of your margin to lag. In a market where the Nasdaq Composite reached 26,376.34 as of June 16, 2026, these fragments of slippage determine your survival. Some alerts become "crowded," where too many retail traders chase the same liquidity. TickerAI’s real-time alerts are engineered to minimize this discovery-to-entry window, providing the speed required for modern execution.
Categorisation: Identifying Your Personal Edge
Identify where your specific edge lies. Segment your log by sector, market cap, and time of day. You may find that your performance peaks with TickerAI Full-Access swing setups in the technology sector but falters with Pro intraday alerts during the mid-day lull. This level of granularity is essential for how to develop a trading plan that actually scales. Use your weekly review to cut underperforming strategies and double down on high-expectancy setups. Professional traders don't just trade; they audit their process, refine their inputs, and treat their trading desk like a high-speed intelligence operation.
Benchmarking and Beta: Is Your Subscription Actually Beating the Market?
Absolute returns are a trap. To understand how to track performance of a stock alert subscription, you must apply the "S&P 500 Test." As of June 17, 2026, the S&P 500 total return sits at 9.01% YTD. If your subscription is yielding 10% but requires active management, a monthly fee, and high execution stress, you're likely underperforming a passive index on a risk-adjusted basis. Professional auditing requires you to subtract your subscription costs and the value of your execution time from your gross gains to find your true net return.
Beta often masquerades as brilliance. If an alert service consistently picks high-beta technology stocks during a Nasdaq rally (which is up 10.3% YTD as of early June 2026), they aren't necessarily finding unique alpha. They're just providing leverage on a rising tide. You need to know if the discovery logic holds up when market momentum stalls. Is the service generating returns independent of the broader indices? This is the critical distinction between a discovery edge and mere execution luck in a bull market.
Opportunity cost is your most significant hidden expense. Every dollar allocated to a lagging alert is a dollar not earning the baseline market return. When you analyze how to track performance of a stock alert subscription, factor in the time spent monitoring alerts. If the service requires four hours of screen time per day to achieve a return that barely clears the benchmark, the "cost of labor" makes the subscription a net negative for most professional participants.
Relative Strength vs. Absolute Returns
A 10% gain is a failure if the underlying sector moved 20% in the same period. True alpha is the return generated above the benchmark. TickerAI’s smart watchlists allow you to track thematic relative strength, ensuring your capital is allocated to the strongest performers within a leading group. If your alerts consistently lag their sector peers, the discovery logic is failing to identify the true leaders of the move.
Auditing the Discovery Logic
Is the service identifying institutional accumulation before the breakout, or just reporting what's already on the news? Consistent performance requires a systematic, AI-driven discovery process that removes human bias. High-quality automated stock market analysis provides the benchmarking logic needed to scale intelligence without increasing manual labor. This ensures your audit is based on repeatable data rather than one-off wins.
Ready to audit your edge with institutional-grade data? Upgrade to TickerAI Pro for real-time discovery tools that prioritize alpha over noise.
Leveraging TickerAI for Data-Driven Performance Discovery
The final stage of a professional audit is infrastructure optimization. Manual logging provides the foundation, but scaling your edge requires automated discovery tools that match the speed of the 2026 market. When you master how to track performance of a stock alert subscription, you realize that delivery speed is the ultimate differentiator. TickerAI Pro provides real-time alerts designed specifically for high-speed execution auditing. These signals include precise technical parameters and immediate timestamps. This transparency allows you to measure slippage against the 10.3% Nasdaq YTD return with clinical precision. Every alert is an auditable data point, not a vague suggestion.
For participants focused on multi-day moves, TickerAI Full-Access offers curated swing trade setups. These setups arrive with clear technical boundaries, including defined stop-loss levels and profit targets. This structure eliminates the ambiguity that often leads to "execution luck" rather than a repeatable discovery edge. By utilizing Smart Watchlists, you can organize these discovery ideas to track thematic performance across specific sectors. This systematic organization reduces the manual labor of performance discovery. It ensures your audit is based on a comprehensive dataset rather than a handful of cherry-picked wins. Automated market scanning further streamlines this process by filtering through the noise of thousands of tickers to find only the highest-conviction setups.
Systematic Discovery over Personal Advisory
TickerAI prioritizes "Opportunity Discovery" to empower your decision-making. We do not offer personal financial advisory or brokerage execution. Instead, we provide the raw, unbiased, AI-generated alerts needed for a clinical audit. This shift is critical. You are transitioning from a passive "subscriber" to a quant-driven participant. By using unbiased discovery signals, you remove the emotional bias of a "guru" and replace it with a data-driven workflow. This is the only way to maintain a professional standard in a fast-moving environment.
Scaling Intelligence in 2026
Modern markets are too fast for manual scanning. TickerAI utilizes advanced discovery logic to filter over 50,000 tickers, identifying actionable setups in seconds. This level of intelligence is a requirement for any professional investment workflow. It allows you to focus on high-level decision-making while the AI handles the tireless task of monitoring and detection. In a market where the S&P 500 total return is 9.01% as of June 17, 2026, finding alpha requires this level of technological leverage.
Audit your discovery process with TickerAI Pro and transform your alert tracking into a professional intelligence operation.
Mastering the Discovery-to-Execution Pipeline
Audit your edge. Stop accepting surface-level win rates as evidence of success. Mastering how to track performance of a stock alert subscription requires a transition from passive consumption to clinical auditing. You've learned to isolate signal alpha from market beta and quantify the alpha decay in your execution. This data-driven approach is the only way to survive a fast-moving environment where the Nasdaq Composite has grown over 37% year-over-year. Your brokerage statement is the ultimate auditor; make sure it reflects a genuine statistical advantage.
Scale your intelligence. Manual logging provides the foundation, but institutional-grade tools provide the speed required for modern discovery. Start your data-driven discovery journey with TickerAI. Access AI-powered real-time alerts, professional smart watchlists, and institutional-grade opportunity discovery designed for the serious participant. Stop guessing and start auditing. Your trading desk deserves professional precision and high-speed intelligence. It's time to trade with calculated confidence.
Frequently Asked Questions
Is paying for stock alerts worth it in 2026?
Paying for alerts is worth it only if the net alpha generated exceeds the subscription cost and execution friction. With the S&P 500 total return at 9.01% YTD as of June 2026, a service must provide a measurable edge over passive indexing. It's a tool for discovery, not a substitute for strategy. Professionals value these services for time-saving and opportunity detection rather than blind following.
How many trades do I need to log to have a statistically significant sample?
Log a minimum of 30 to 50 trades before drawing definitive conclusions. This sample size is necessary to smooth out variance and "execution luck." Smaller samples are often skewed by temporary market momentum or specific sector runs. A professional audit requires enough data to calculate a reliable Profit Factor and expectancy across different market conditions.
What is a good win rate for an AI-powered stock alert subscription?
A sustainable win rate typically ranges between 40% and 60%, provided the Reward-to-Risk ratio is at least 2:1. High win rates above 80% often signal "scalping" strategies with massive tail risks that can wipe out weeks of gains in one move. Focus on the mathematical expectancy of the signals rather than the raw percentage of successful trades.
How do I calculate the ROI of my stock alert service membership?
Calculate ROI using the formula: (Net Profit minus Subscription Cost) divided by Subscription Cost. Net profit must account for brokerage commissions and slippage. If your net return after fees doesn't significantly outperform the 10.3% Nasdaq YTD benchmark, your capital might be better allocated to a passive index fund. ROI is the ultimate filter for subscription renewal.
What should I do if the "official" results of a service don’t match my trades?
Audit your execution lag and slippage immediately to find the source of the delta. Official results often assume "perfect" fills at the exact alert price, which is rarely achievable in live markets. If the gap consistently exceeds 1% per trade, the service may be too crowded. This friction suggests the discovery-to-execution window is too narrow for your current infrastructure.
Can I track stock alert performance using a standard spreadsheet?
Yes, a spreadsheet is effective if it includes fields for timestamps, slippage, and discovery logic. Understanding how to track performance of a stock alert subscription requires more than just a profit and loss column. You must log the "Alert Price" versus your "Actual Fill" to quantify Alpha Decay. Use these logs to identify if your edge comes from the signal or your own execution speed.
How often should I audit my stock alert subscription performance?
Perform a high-level execution review weekly and a comprehensive performance audit monthly. Weekly reviews help you catch rising slippage costs or platform lag before they drain your account. Monthly audits allow you to compare your realized returns against market benchmarks like the S&P 500. Consistent auditing ensures you aren't paying for a service that has lost its market fit.
What is the most important metric for evaluating an alert service?
Profit Factor is the institutional gold standard for evaluation. It represents your gross wins divided by your gross losses. A profit factor above 1.0 indicates a profitable system, but professionals look for 1.5 or higher to provide a cushion for market volatility. This metric is more reliable than win rate because it accounts for the actual dollar magnitude of your trades.