

An AI alert is not a command; it is a raw data point that will erode your capital without a clinical validation framework. In a 2026 market where infrastructure plays like Nebius have surged 187% while legacy giants like Microsoft have retraced more than 20%, the margin for error is non-existent. You have likely felt the paralysis of receiving multiple signals or the frustration of being "wicked out" by a stop-loss that was too tight for current volatility. Interpreting AI stock alerts for entry and exit points requires more than just clicking buy. It demands a systematic approach to risk.
We understand that the speed of modern markets makes manual analysis impossible, yet blind trust in an algorithm is equally dangerous. You need a way to filter the noise. This guide will help you master the precision required to transform raw AI signals into actionable trade executions with defined risk-reward parameters. We will provide a repeatable system for validating entries, mathematical frameworks for setting take-profit targets, and methods to reduce emotional stress during high-volatility events. It is time to move beyond discovery into the realm of professional execution.
Key Takeaways
- Decode the multi-variable momentum anomalies within each alert by prioritizing confidence scores and probability weighting to separate signal from noise.
- Execute entries with clinical precision using the "Golden Minute" rule and VWAP confirmation to filter out low-probability price action and false breakouts.
- Protect your equity curve with a dual-exit strategy that transitions from initial stop-losses to breakeven pivots as trade momentum builds.
- Develop a repeatable framework for interpreting AI stock alerts for entry and exit points by aligning individual signals with top-down market trends and sector rotation data.
- Optimize your discovery workflow by implementing high-speed, systematic execution tools that prioritize real-time data over manual, emotion-driven analysis.
The Anatomy of an AI Stock Alert: Signal vs. Noise
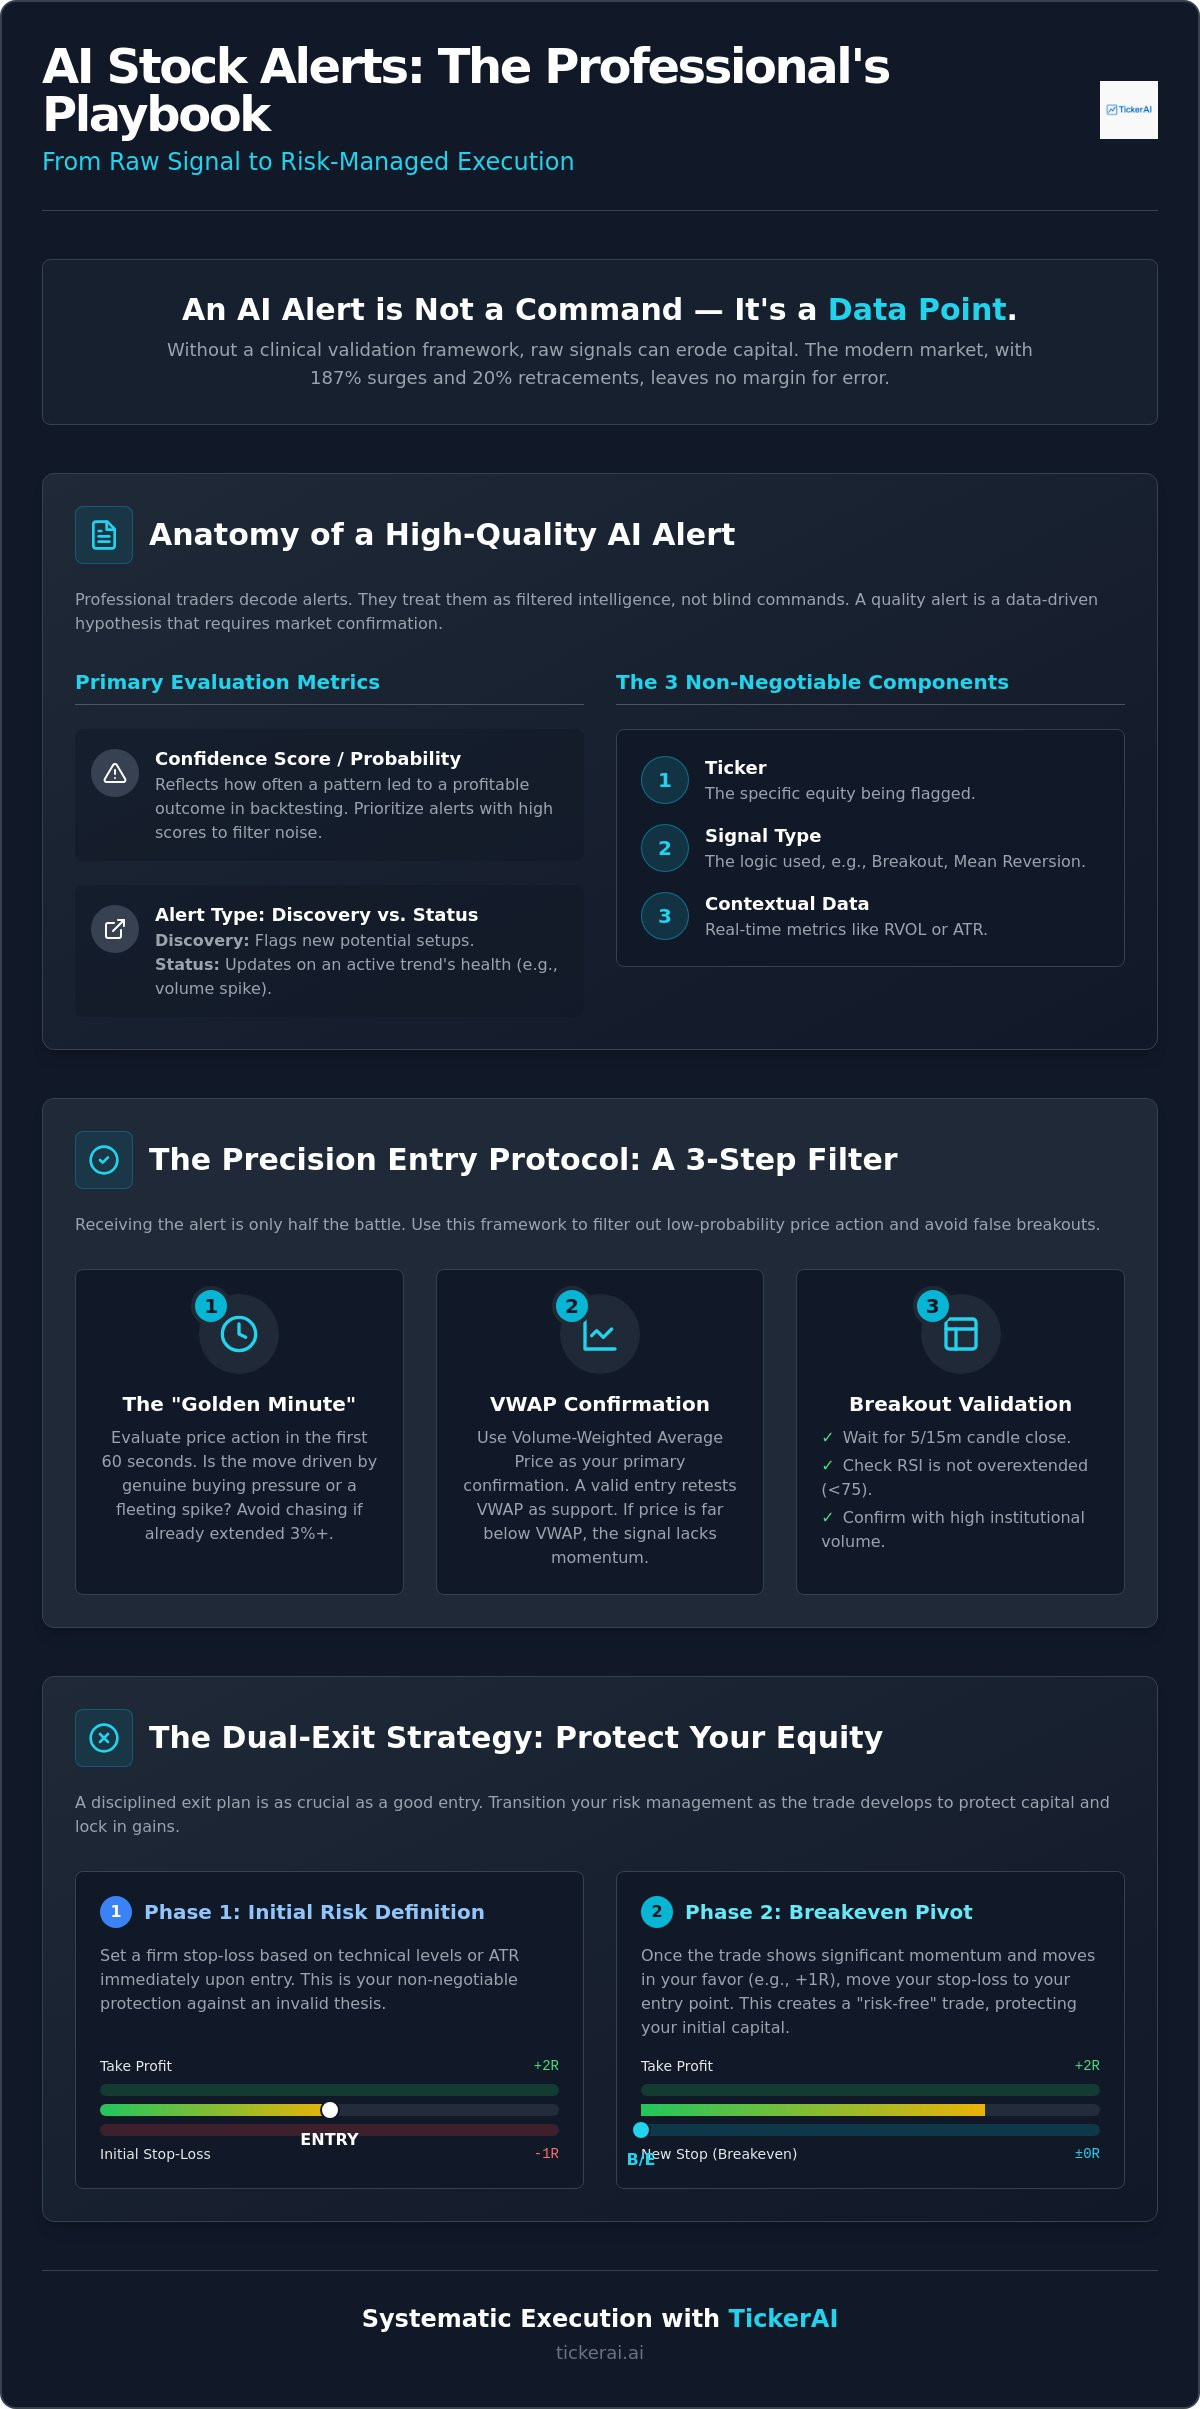
Professional traders don't treat alerts as commands. They treat them as filtered intelligence. Interpreting AI stock alerts for entry and exit points starts with a clinical breakdown of the signal's origin. An AI alert is a multi-variable detection of a momentum or value anomaly. It is the result of an algorithm processing price action, volume, and sentiment data to find a statistical edge. This isn't a simple "buy" notification; it is a notification that a specific equity has moved into a high-probability zone based on historical backtesting.
Most high-end systems provide a Confidence Score or Probability Weighting. This metric reflects how often a specific pattern has resulted in a profitable outcome under similar volatility regimes. You must also distinguish between Discovery Alerts and Status Alerts. Discovery alerts flag new setups that haven't yet reached their trigger price. Status alerts provide updates on an active trend's health, such as a trendline confirmation or a volume spike. Every quality alert must contain three non-negotiables:
- Ticker: The specific equity being flagged.
- Signal Type: The logic used, such as Mean Reversion or Breakout.
- Contextual Data: Real-time metrics like Relative Volume (RVOL) or Average True Range (ATR).
Understanding Algorithmic Discovery
Human eyes are limited to linear trendlines and basic oscillators. Modern Algorithmic Trading identifies non-linear correlations across hundreds of variables simultaneously. These systems scan the entire market in milliseconds to reduce execution latency. Systematic discovery allows you to position yourself ahead of the curve. It's the difference between identifying institutional accumulation and chasing a "hot" stock after it has already gained 15%. By the time a human notices a trend, the algorithm has already calculated the risk-reward ratio and issued the alert.
Filtering for Action-Oriented Signals
Information overload leads to hesitation. Alert fatigue occurs when a trader is bombarded with low-probability signals, causing them to miss the high-conviction setups. You should set strict parameters to only receive alerts that meet a specific probability threshold. This ensures your attention is focused only on trades with the highest expected value. By filtering for high-conviction setups, you reduce the noise and maintain the mental clarity needed for execution. An AI alert is a data-driven hypothesis that requires market confirmation.
Interpreting Entry Points: Momentum and Breakout Mechanics
Receiving the alert is only half the battle. The first sixty seconds, often called the "Golden Minute," determine the trade's viability. You must evaluate price action immediately. Is the stock surging on genuine buying pressure, or is it a momentary spike? Interpreting AI stock alerts for entry and exit points requires a clinical assessment of the order book. If the ticker is already 3% extended within seconds, the risk-reward ratio has likely collapsed. You need a filter.
Use Volume-Weighted Average Price (VWAP) as your primary confirmation tool. Professional traders rarely enter long positions when the price is significantly disconnected from VWAP. A valid entry typically occurs when price consolidates just above this level or successfully retests it as support. If the price is hovering below VWAP despite a bullish AI alert, the signal lacks immediate momentum. It's an observation, not an execution. Similarly, watch for liquidity traps. AI can detect volume surges, but if that volume consists of retail "churn" rather than institutional block trades, the move won't sustain. Verification is your safeguard against false positives.
The Breakout Confirmation Workflow
Impatience kills equity curves. Wait for the 5-minute or 15-minute candle to close before committing capital. A breakout that fails to hold the close of a 15-minute candle is often a "bull trap." Check the Relative Strength Index (RSI). If the RSI is already printing above 75 on the 5-minute chart, the move is overextended. Look for institutional footprints. High-conviction entries are characterized by sustained volume bars that dwarf the previous twenty candles. This confirms that "big money" is participating in the move identified by the AI.
Avoiding the 'Chasing' Trap
Discipline is a mathematical requirement. Establish a maximum chase percentage. A common professional standard is the 1% rule: never buy a stock more than 1% above the original alert price. If you miss that window, you wait for a pullback or move to the next signal. Mastering proactive vs reactive trading is the difference between a professional and a hobbyist. Reactive traders buy the peak out of FOMO; proactive traders set limit orders at logical support levels. Utilizing a TickerAI Pro subscription allows you to automate these watchlists, ensuring you only engage when the price hits your specific entry zone. Limit orders remove the emotional friction of manual execution, keeping your process entirely clinical.
The Dual-Exit Strategy: How to Set Stop-Loss and Take-Profit on Alerts
Entry is discovery. Exit is execution. While a high-conviction signal identifies the opportunity, your exit strategy dictates the long-term health of your equity curve. Most retail traders fail because they treat the exit as an afterthought. For a professional, the exit is planned before the order is filled. Interpreting AI stock alerts for entry and exit points is a binary exercise in risk management. You are either protecting capital or harvesting gains. There is no room for "feeling" the market.
Before placing a trade, you must calculate your reward-to-risk ratio. A standard professional framework targets a minimum of 2:1 or 3:1. If the AI-calculated expected move suggests a 4% upside but the logical stop-loss requires a 3% downside, the trade is mathematically unsound. You should utilize the "Initial Stop" to define your maximum risk and transition to a "Breakeven Pivot" once the price reaches its first technical milestone. This proactive adjustment removes the risk of a winning trade turning into a loss during sudden volatility spikes.
Stop-Loss Frameworks: Protecting Your Capital
Flat percentage stops are a relic of manual trading. They don't account for individual stock volatility. Instead, use ATR-based stops. Average True Range (ATR) allows you to set exits based on how a specific ticker actually moves. A stock like Sandisk (SNDK), which saw a 780% increase in early 2026, requires a wider "volatility buffer" than a low-beta utility stock. Alternatively, use Technical Level Stops. Place your exit below a 20-day EMA or a verified support floor. If the price action invalidates these levels, the AI's thesis is broken. Finally, implement a Time Stop. If the predicted momentum does not materialize within a specific window, exit the position. Capital is a tool; don't let it sit idle in a stagnant trade.
Take-Profit Frameworks: Harvesting Gains
Greed is the enemy of consistency. Professional traders use a scaling-out approach. Take 50% of your profit at the first target to lock in gains and reduce the trade's psychological weight. The remaining 50% can be managed with trailing stops. Use algorithmic signals to capture extended momentum moves, allowing the stock to "run" until the trend structurally shifts. This ensures you don't exit too early while still protecting the core of the win. A take-profit is the point where the AI's edge has been fully realized. Interpreting AI stock alerts for entry and exit points means knowing when the statistical advantage has evaporated and moving on to the next high-probability signal.
Verification Framework: Correlating AI Signals with Market Context
A high-conviction signal is only as strong as the environment it inhabits. Executing a trade based on an isolated alert is a fundamental error. Professional traders utilize a top-down filter to validate every signal. If the S&P 500 or Nasdaq is trending below its 50-day moving average, even the strongest bullish alert faces significant macro headwinds. For traders navigating these indices, utilizing an SPX to SPY Converter helps bridge the gap between index-level technicals and liquid ETF execution. You must verify that the broader market trend supports the micro signal. Interpreting AI stock alerts for entry and exit points requires this multi-layer verification to ensure you aren't fighting the tape during periods of systemic weakness.
Check for sector rotation alignment before committing capital. Use automated market sector rotation analysis to determine if the alert's industry is currently attracting institutional capital. In the first half of 2026, capital has rotated heavily into AI infrastructure like Nebius (NBIS), while legacy software giants like Microsoft have faced significant retracements. An alert in a "cold" sector has a lower probability of sustained follow-through. You should also perform a catalyst check. Did the AI detect unusual volume ahead of an SEC filing or an earnings report? Use sentiment overlay tools to confirm the move isn't just retail-driven hype. If social media sentiment is peaking but institutional volume is flat, you are likely looking at a "pump" rather than a sustainable trend.
The Institutional Buying Signal
Smart money leaves distinct footprints. When you receive an alert, cross-reference it with dark pool activity or significant block trades. Institutional flow is the ultimate confirmation for any swing trade setup. It's the difference between a fundamental breakout and a temporary short squeeze. Squeezes are volatile and often mean-reverting. Fundamental breakouts backed by institutional accumulation have the "legs" to reach extended take-profit targets. If you can't find evidence of "Big Money" participation, treat the alert as a low-conviction setup.
Risk Management Overlay
Clinical discipline is your only protection against market randomness. Never risk more than 1-2% of your total account value on a single trade. If you receive five alerts in the semiconductor industry, taking all five creates dangerous correlated risk. If the sector drops, your entire portfolio suffers. You need to normalize your exposure. Use a swing trade risk management calculator to determine exactly how many shares to buy based on your stop-loss distance. This ensures that a single failed trade doesn't derail your equity curve. To start implementing these filters systematically, you can optimize your discovery workflow with TickerAI.
Scaling Discovery: Implementing Systematic Execution with TickerAI
Scaling your trading operations requires moving beyond manual scanning. It's about infrastructure. TickerAI Full-Access provides the high-fidelity raw data necessary for interpreting AI stock alerts for entry and exit points with institutional-grade precision. While a hobbyist reacts to price, a systematic trader anticipates it. By utilizing TickerAI Pro, you gain a speed advantage in volatile sectors like Technology. In a 2026 market where infrastructure plays like Nebius (NBIS) can surge 187% while others lag, speed is your only defense. This isn't just about getting alerts; it's about the speed of delivery and the depth of the underlying logic.
Integrating insights from an AI stock discovery platform into your daily trading journal creates a feedback loop. You aren't just taking trades. You're auditing an engine. This transition from discretionary guessing to systematic execution is what separates profitable equity curves from stagnant ones. You need a partner that is always "on," scanning thousands of tickers while you focus on high-level decision making. It's time to stop treating the market as a mystery and start treating it as a data set.
Building Your Smart Watchlist
Efficiency is the byproduct of organization. Use TickerAI to categorize incoming signals into "High Conviction" and "Watch" lists. High conviction alerts meet all your verification criteria instantly, such as VWAP alignment and sector strength. "Watch" alerts are those where the anomaly is detected, but the market context isn't yet perfect. Setting custom filters ensures you only see signals that align with your specific risk-reward parameters. This prevents information overload and keeps your focus on the highest probability setups. The platform's historical "Win Proofs" provide the data-driven confidence needed to trust the engine's output during high-volatility events. It's about building a clinical relationship with the data.
The 2026 Trading Workflow
Professional execution follows a rigid, three-step logic. First, you receive the TickerAI alert. Second, you perform the top-down verification discussed in previous sections. Third, you execute with a predefined exit. Trusting automated stock market analysis removes the hesitation that costs retail traders thousands in missed gains. It keeps your process clinical. It keeps your emotions sidelined. You don't have to guess if a breakout is real. The system has already calculated the probability. Your job is to manage the risk. Stop chasing the market. Start filtering it. Scale your market intelligence with TickerAI Full-Access today.
Mastering Algorithmic Alpha in 2026
The 2026 market doesn't reward hesitation. It rewards infrastructure and systematic execution. You've learned that a raw signal is merely the starting point of a professional trade. Success depends on interpreting AI stock alerts for entry and exit points through a clinical lens of macro verification and mathematical risk management. By implementing VWAP confirmation for entries and ATR-based frameworks for exits, you replace emotional friction with algorithmic precision. This shift from reactive chasing to proactive discovery is essential for protecting your equity curve during high-volatility events. It's time to stop guessing and start executing based on statistical probability.
Scaling this process requires a tireless intelligence partner. TickerAI Pro provides the advanced algorithmic analysis and real-time alerts necessary to capture professional-grade alpha in fast-moving sectors. Whether you are identifying swing trade setups or long-term investment ideas, the goal remains the same: transforming raw data into actionable execution. The tools for institutional-level insights are now within your reach. Discover high-potential market moves with TickerAI Pro and start executing with clinical confidence today. Your path to systematic trading starts now.
Frequently Asked Questions
How do I know if an AI stock alert is a 'fakeout'?
Fakeouts are identified by a lack of volume confirmation and immediate price rejection. Professional verification involves checking the "Golden Minute" for sustained bid support. If the price breaches a technical level but fails to hold the 5-minute candle close, the signal is invalidated. Interpreting AI stock alerts for entry and exit points requires looking for institutional footprints; if the volume bars are thin, the move is likely retail-driven churn.
What is the best reward-to-risk ratio for AI-driven swing trades?
A minimum reward-to-risk ratio of 2:1 is the professional standard for algorithmic discovery. This ensures that even a 40% win rate remains profitable over a large sample size. You should identify your technical target and stop-loss before execution. If the AI's expected move doesn't allow for at least double your risk, skip the trade. Capital preservation is the priority; never compromise the math for a single alert.
Should I use market orders or limit orders when responding to an alert?
Limit orders are mandatory for maintaining clinical discipline. Market orders during high-volatility events lead to slippage, which erodes your risk-reward ratio. Set your limit at a logical support level or within the 1% chase threshold. This ensures you only enter at a price that justifies the trade thesis. If the price moves too fast, let it go. There is always another signal being generated by the engine.
How much of my portfolio should I allocate to a single AI trade setup?
Professional risk management dictates a 1% to 2% risk of total account value per trade. This is not the total position size but the amount lost if the stop-loss is hit. Use a position size calculator to normalize your exposure based on the stock's specific volatility. In the 2026 market, over-allocation to a single ticker creates systemic risk. Diversify your discovery across multiple high-conviction signals to protect your equity curve.
Can AI alerts predict the exact exit point for a stock?
AI doesn't predict "exact" points; it identifies high-probability zones where the statistical edge evaporates. Interpreting AI stock alerts for entry and exit points involves using these zones to set take-profit targets. The algorithm calculates an "Expected Move" based on historical volatility and current momentum. Treat these levels as areas to scale out rather than absolute price targets. The market remains dynamic; your exit must be a logical reaction to data.
What happens if a stock hits my stop-loss and then immediately rallies?
A stop-loss hit followed by a rally is a "wick out" and is a standard part of trading variance. Don't take it personally. If the stock re-enters a valid setup with new institutional volume, you can re-evaluate for a second entry. However, never ignore your initial stop-loss in hopes of a recovery. Stick to the clinical framework. Capital protection is more important than catching every single move in a volatile ticker.
How many AI alerts should a trader realistically manage per day?
Quality beats quantity in systematic trading. Realistically, a professional trader should focus on 3 to 5 high-conviction alerts per day. Managing more leads to information overload and execution errors. Use custom filters to narrow the firehose of raw data into a manageable stream. Focus your attention on signals that align with top-down market trends and sector rotation for the highest probability of success.


