

Global AI investment has reached $1 trillion in 2026. This massive capital influx has fundamentally shifted how alpha is generated. If you're still wasting hours on manual chart scanning, you're fighting an uphill battle against State Space Models that process vast sequences of market data with clinical efficiency. Information overload is no longer just a nuisance; it's a structural barrier. Static indicators often lead to "fakeouts" that drain your capital and your confidence.
You need a way to filter the noise and prioritize high-probability setups. This guide teaches you how AI-powered stock anomaly detection identifies significant market movements before they hit the mainstream. We'll detail a repeatable system for discovering hidden opportunities, significantly reducing the time you spend on manual discovery. You'll gain the technical edge required for higher confidence in your swing trade entries. We're moving beyond reactive trading into a proactive, data-driven workflow. It's time to leverage the same high-speed intelligence used by the world's most sophisticated desks.
Key Takeaways
- Understand why traditional "If-Then" scanners fail in 2026 and how AI identifies true deviations from expected price and volume patterns.
- Master the mechanics of AI-powered stock anomaly detection by leveraging unsupervised learning to isolate unusual behavior before the mainstream reacts.
- Learn to categorize anomalies into Point or Contextual types to separate meaningless volatility from strategic sector-driven opportunities.
- Build a repeatable discovery workflow that integrates real-time alerts with macro catalyst verification for more precise swing trade entries.
- Shift from manual scanning to automated filtering with TickerAI to maintain a high-speed intelligence advantage in a machine-driven market.
The Evolution of Market Discovery: Why Static Scanners Fail
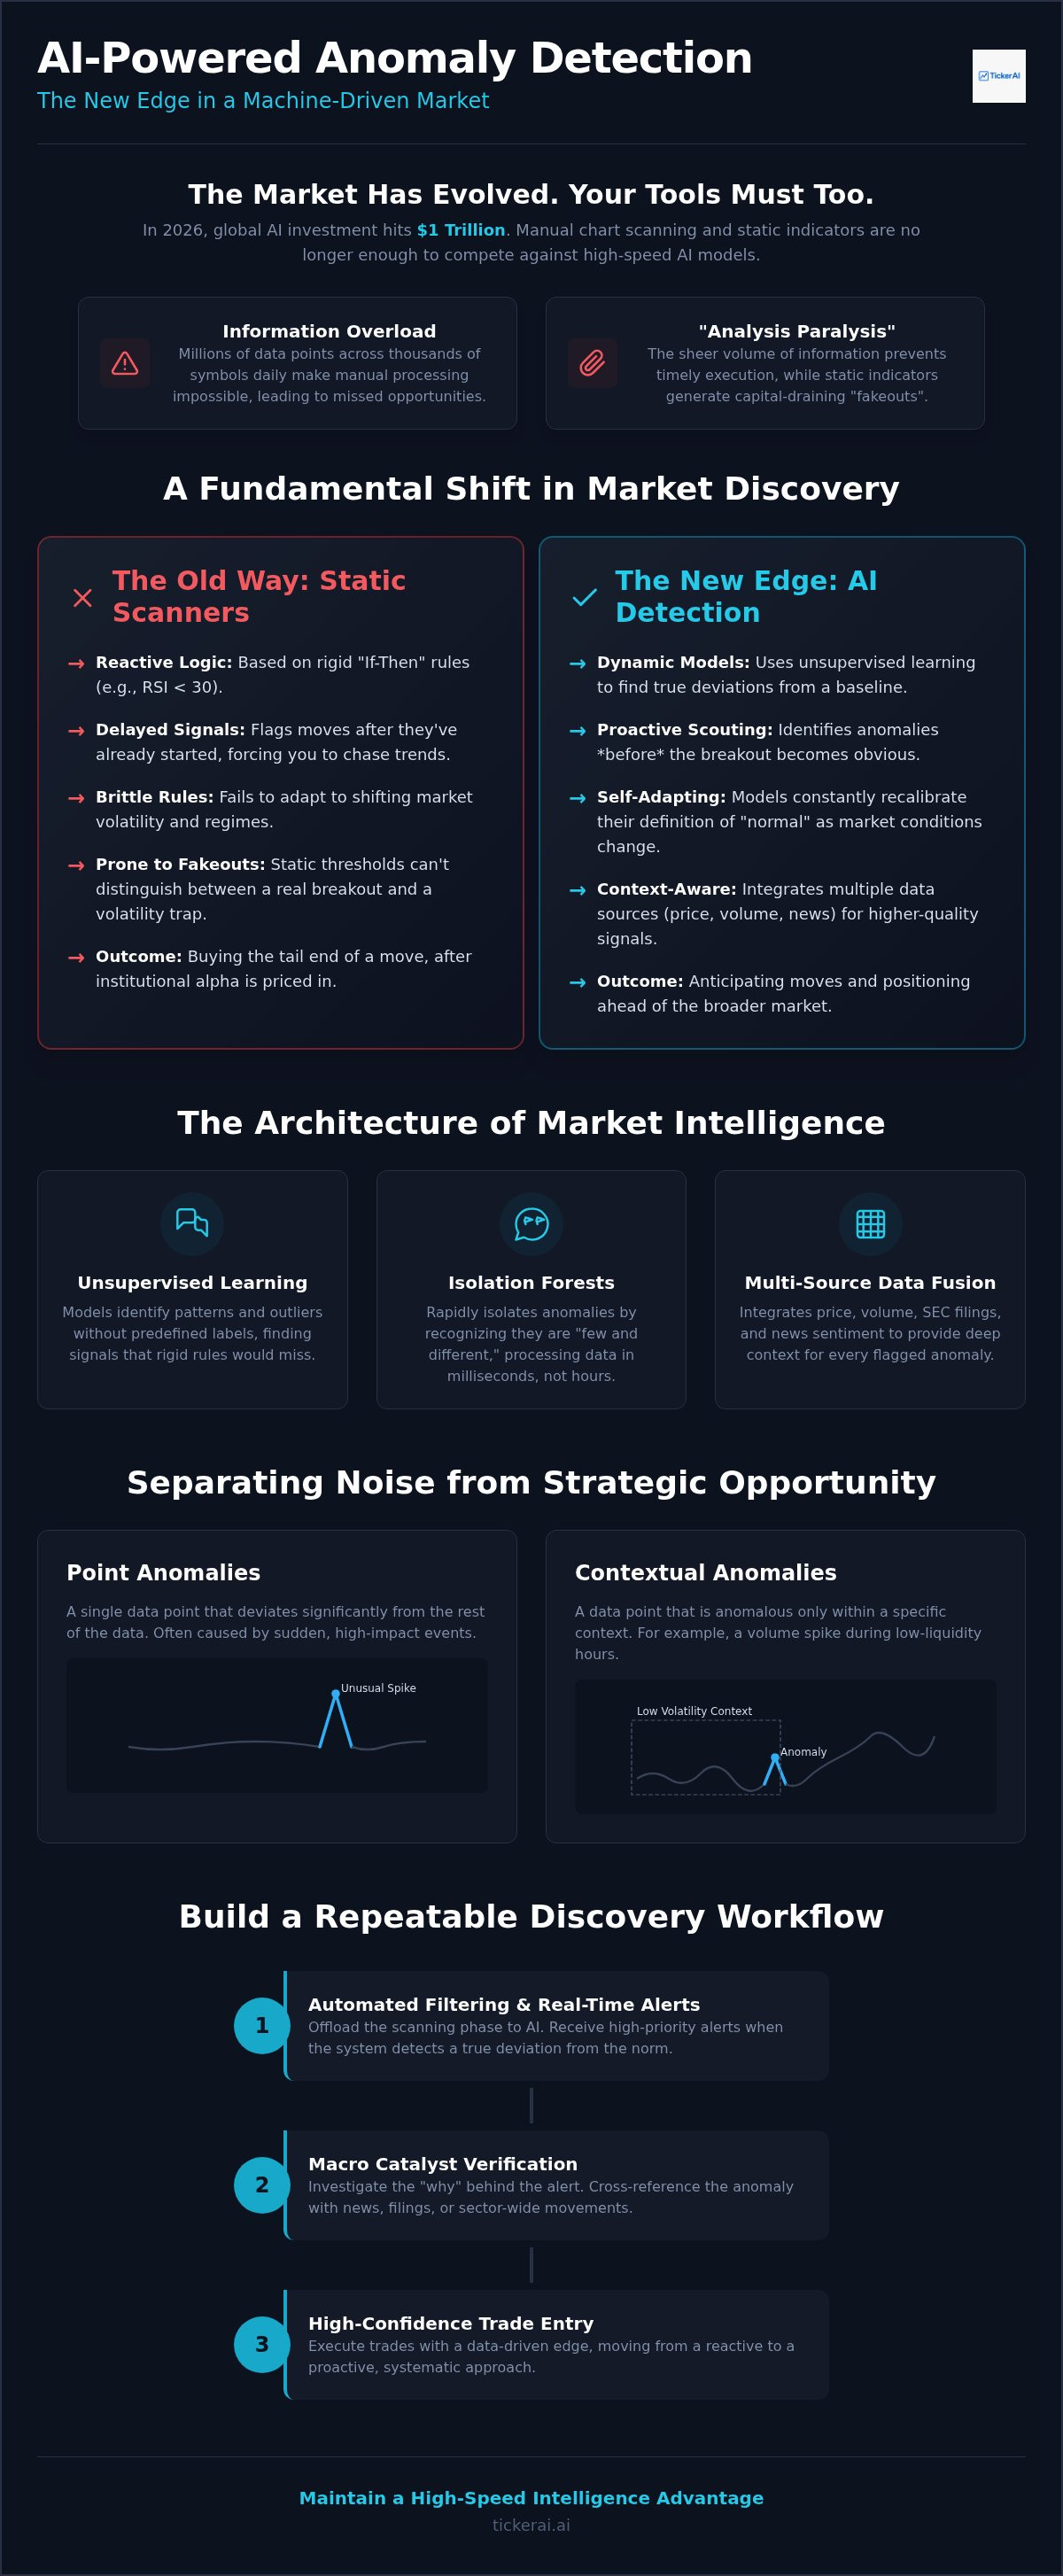
Traditional market discovery methods are obsolete. In 2026, high-frequency algorithms and sophisticated State Space Models dominate the tape. Relying on static scanners is a liability. AI-powered stock anomaly detection represents the next phase of technical analysis. It is the systematic identification of outliers in price, volume, and volatility that deviate from a ticker's historical and contextual baseline. Unlike basic filters, these models perform deep anomaly detection to find hidden signals that precede significant price moves.
Most traders still use "If-Then" logic. RSI crosses 30. Price hits the 200-day EMA. These are reactive signals. By the time a static scanner flags a move, the institutional "Algorithmic Alpha" is already priced in. You're buying the tail end of the move. Proactive algorithmic scouting flips this dynamic. It identifies the anomaly before the breakout, allowing you to position yourself before the trend becomes obvious to the broader market. This is the difference between chasing a move and anticipating one.
The Information Overload Problem in 2026
Every trading day generates millions of data points across thousands of symbols. Processing this manually is impossible. The result is a cognitive bottleneck. Traders often suffer from "Analysis Paralysis," where the sheer volume of information prevents timely execution. To stay profitable, you must learn how to avoid analysis paralysis when investing by offloading the scanning phase to automated systems. Efficiency is the only way to survive a market where 88% of organizations have already integrated artificial intelligence into their operations.
Static Rules vs. Dynamic AI Models
Hard-coded thresholds are brittle. They don't account for shifting market regimes. A volume spike in a low-liquidity environment has a different meaning than one in a high-liquidity environment. AI-powered stock anomaly detection uses dynamic models that adapt to shifting volatility. These systems recognize when a "breakout" is actually a trap. They provide a systematic approach to stock investing that replaces gut feeling with data-driven precision. When the market shifts from bull to bear, these models recalibrate their "normal" baseline instantly. You don't have to wait for the indicators to catch up; the intelligence is already there.
How AI Detects Anomalies: The Architecture of Market Intelligence
The infrastructure of modern alpha is built on unsupervised learning. This architecture allows models to identify patterns without predefined labels. It doesn't wait for a human to define a "breakout." Instead, it maps the multidimensional space of market data and flags anything that doesn't fit. This process is the core of effective AI-powered stock anomaly detection. It replaces rigid rules with fluid, mathematical boundaries.
Isolation Forests are central to this detection engine. They work on a simple premise: anomalies are few and different. By recursively partitioning data, these models isolate outliers much faster than they can cluster normal points. In a high-frequency environment, this speed is a prerequisite for survival. Manual charting takes hours. Algorithmic isolation takes milliseconds. Monitoring these shifts requires a tool that acts as a proactive scout. You can explore how our discovery engine filters these anomalies in real-time.
Machine Learning Models for Momentum Discovery
Predicting "normal" behavior is the first step in spotting a deviation. Advanced regressors, such as CatBoost, analyze historical market cycles to establish a baseline for every ticker. These models are trained on decades of data, learning how price and volume correlate during various volatility regimes. When current behavior diverges from this trained baseline, an anomaly is flagged. Transitioning to automated stock market analysis is no longer optional for those seeking to scale their intelligence. It allows for the discovery of momentum breakouts while they are still in the incubation phase.
Data Sources: Beyond the Price Action
Effective detection requires more than just a price feed. Modern models integrate SEC filings and news sentiment to provide context. A price spike accompanied by an unusual Form 4 filing suggests institutional buying pressure rather than random retail volatility. The efficacy of this approach is well-documented. A Stanford GSB AI analyst study revealed that AI models using public data significantly outperformed 93% of human mutual fund managers over three decades. AI quantifies these "unusual" signals instantly. It delivers real-time market alerts that allow traders to act before the information is fully digested by the mainstream media. This multi-dimensional view ensures that every flagged anomaly is backed by a convergence of data points.
Point, Contextual, and Collective Anomalies in Trading
Not all market deviations indicate a profitable setup. To extract alpha, you must categorize the signal. AI-powered stock anomaly detection classifies outliers into three distinct categories: point, contextual, and collective. This classification is vital. It prevents you from chasing random noise and focuses your capital on structural shifts. Recent research on transformer AI architectures suggests these advanced models are significantly better at identifying these complex patterns than traditional neural networks.
- Point Anomalies: A singular data point that falls outside the entire distribution. This is the "Flash Spike." It's a sudden, massive volume surge or a price gap that occurs in seconds.
- Contextual Anomalies: A data point that is considered normal in one context but anomalous in another. A 4% move in a volatile tech stock is standard. That same 4% move in a consumer staple ticker is a red flag.
- Collective Anomalies: A sequence of data points that are anomalous when viewed as a group. This is the hallmark of institutional activity. No single trade looks unusual, but the aggregate behavior reveals a clear deviation from the norm.
Identifying these patterns is critical for finding thematic investment opportunities. When you can distinguish between a temporary glitch and a structural shift, you gain a significant timing advantage. It allows you to enter positions while the "Smart Money" is still building, rather than after the news has hit the tape.
Spotting Institutional Footprints
Collective anomalies are the primary way to track institutional activity. Large funds don't enter positions all at once. They use sophisticated execution algorithms to hide their tracks over days or weeks. AI identifies the subtle, persistent lift in volume and price support that retail scanners miss. Smart Money Flow is the systematic detection of institutional accumulation through the identification of collective data outliers. Distinguishing this from retail FOMO is critical. Retail surges are usually point anomalies. Institutional builds are collective, methodical, and far more sustainable.
Sector-Relative Anomalies
Context is everything in the 2026 market. A 5% move in Tech might be noise during a high-beta rally. A 5% move in Utilities is often a structural anomaly indicating a flight to safety or a specific regulatory catalyst. AI-powered stock anomaly detection evaluates every ticker against its sector peers in real-time. This prevents false positives during broad market rallies. Understanding these shifts is essential for finding thematic investment opportunities with AI. When an entire sector remains flat while one ticker exhibits a contextual anomaly, you've found a potential lead-lag opportunity.
Designing a Workflow Around Anomaly Alerts
High-speed data is useless without a structured execution framework. When an AI-powered stock anomaly detection engine flags a ticker, the clock starts. A professional workflow moves from raw detection to calculated entry through a series of logical gates. You don't trade the anomaly; you trade the confirmation of the anomaly. This process ensures your capital is only deployed on high-conviction setups.
- Step 1: Classification. Receive the real-time alert. Immediately identify if the signal is a Point, Contextual, or Collective anomaly. Knowing the type dictates the holding period.
- Step 2: Catalyst Verification. Cross-reference the outlier with market catalysts. Check for earnings surprises, FDA approvals, or macro shifts. An anomaly with a fundamental "why" is far more potent.
- Step 3: Risk Assessment. Evaluate the risk/reward ratio. Use rule-based entry criteria. If the price has already moved 10% beyond the detection point, the trade may be "extended."
- Step 4: Organization. Add high-conviction alerts to a Smart Watchlist. This centralizes your discovery and allows for automated monitoring of price action near key levels.
Filtering Noise from Signal
Not every anomaly is a trade. Some are simply low-probability volatility or "bad prints" in the data stream. You must master how to interpret AI stock signals to separate structural shifts from temporary noise. A key technique involves using the "anomaly range." This is the price zone where the deviation was first isolated. Set technical stop-losses just below this range. If price reverts through the anomaly zone, the thesis is void. This clinical approach protects your capital from the "fakeouts" that frequently trap retail participants using static indicators.
Building a Repeatable Discovery Process
Consistency beats gut feeling. In a machine-driven market, manual intuition is a structural liability. You need a system that functions as a tireless assistant. TickerAI Full-Access automates the "Scout" phase of your trading day. It scans thousands of tickers in seconds while you focus on execution and risk management. By trusting a quantitative discovery process, you remove the emotional bias that leads to overtrading. It's about moving from a reactive hunter to a proactive strategist. Build your repeatable discovery engine with TickerAI Full-Access to maintain your edge in the 2026 market.
TickerAI: Your Proactive Scout for Market Anomalies
TickerAI functions as a tireless, high-tech assistant. It filters and prioritizes the chaotic market environment. While most retail traders are overwhelmed by information, TickerAI users focus on decision-making. The platform uses AI-powered stock anomaly detection to scan thousands of tickers across the market. It doesn't just find volatility; it finds the 1% of moves that represent structural opportunity. This precision is essential in a market where global AI investment has reached $1 trillion in 2026.
The platform offers two distinct tiers for different professional needs. TickerAI Pro Subscription provides unlimited analyses and access to the full research workspace. For those seeking the ultimate automated scout, the TickerAI Full-Access Subscription includes the smart watchlist and real-time alerts. These tools allow you to organize discovered anomalies by theme, sector, or catalyst. This organization is crucial for maintaining a high-speed intelligence advantage. It ensures that you aren't just seeing data; you're seeing actionable setups.
Users receive curated swing trade setups that are built on clinical precision. These aren't based on gut feeling or static indicators. They are the result of systematic analysis of market mechanics and institutional footprints. This provides an Institutional Edge once reserved for elite hedge funds. By using TickerAI, you move from a reactive participant to a proactive strategist. You gain the confidence to enter trades before the mainstream media catches on.
The TickerAI Edge: Speed and Precision
Scanning thousands of stocks manually is a liability. TickerAI does it in seconds. The platform identifies momentum breakouts through AI-powered stock anomaly detection, analyzing price, volume, and sentiment data simultaneously. It filters the noise and surfaces the high-probability setups that fit your specific criteria. Smart Watchlists act as the central hub for these thematic opportunities. TickerAI’s mission is defined by Innovative Pragmatism in market research. It values technology for the specific, tangible advantages it provides in terms of time-saving and clarity.
Getting Started with Systematic Discovery
Moving from manual research to AI-powered discovery is a low-friction transition. The native iOS application requires iOS 18 or later. It puts institutional-grade intelligence in your pocket. You can stop fighting information overload and start executing with precision. Join the TickerAI community for real-time market intelligence and a more calculated approach to swing trading. It's time to let the machine handle the discovery so you can handle the alpha.
Explore TickerAI Subscription Plans
Mastering the Algorithmic Edge in 2026
The shift from reactive manual scanning to proactive discovery is complete. Success in the current market requires a clinical approach to data. Static rules consistently fail to capture the nuance of institutional accumulation and complex sector rotation. By implementing AI-powered stock anomaly detection, you move beyond the noise and focus exclusively on structural deviations. This systematic process transforms raw market data into high-conviction entries. You no longer have to fight information overload; you simply filter it through a professional-grade lens.
It's time to offload the "scout" phase of your trading day to a high-speed intelligence partner. TickerAI provides the professional-grade market discovery tools needed to scale your analysis. You'll benefit from real-time algorithmic alerts and curated swing trade setups that prioritize precision over hype. This isn't about chasing every spike; it's about identifying the 1% of moves worth your capital. Discover high-potential stock anomalies with TickerAI and take control of your discovery workflow. The machine handles the detection while you handle the execution. You've got the roadmap; now it's time to deploy the intelligence.
Frequently Asked Questions
What is an anomaly in the stock market?
An anomaly is a statistical outlier where price, volume, or volatility deviates significantly from a ticker's historical baseline. It represents a structural break in the standard market pattern. These deviations often precede significant momentum breakouts or trend reversals. In 2026, identifying these outliers is the primary method for generating alpha. It allows traders to spot institutional activity before it becomes obvious to the broader market.
How does AI-powered anomaly detection differ from traditional stock screening?
Traditional screening uses static "If-Then" rules like RSI crosses 30. AI-powered stock anomaly detection uses unsupervised learning to find patterns without predefined labels. It adapts to shifting market regimes in real-time. While a static scanner might flag fifty stocks, AI filters for the 1% that are truly anomalous. This reduces false positives and ensures you focus on high-conviction opportunities rather than generic volatility.
Can AI anomaly detection predict stock market crashes?
It identifies the collective anomalies and unusual volatility that often precede a crash, but it doesn't predict the future with certainty. The system flags deviations in institutional flow and hedging activity. When these outliers cluster across multiple sectors, it indicates a high-risk environment. Traders use these signals to reduce exposure or hedge positions before mainstream panic begins. It's a proactive risk management tool.
Is AI anomaly detection suitable for long-term investors or just day traders?
It serves both by identifying structural shifts that impact various timeframes. While day traders use point anomalies for quick scalps, long-term investors look for collective anomalies. These reveal slow, hidden accumulation by institutional funds over weeks or months. Spotting these footprints allows long-term participants to enter positions at a better cost basis. It's about finding the start of a multi-month trend rather than just a daily spike.
How many stocks can TickerAI scan for anomalies at once?
TickerAI performs automated market scanning across thousands of tickers simultaneously. The platform processes millions of data points in real-time to isolate the most significant outliers. This scale is impossible to achieve through manual charting or basic retail scanners. By offloading this high-speed discovery to an AI scout, you ensure no high-potential movement goes unnoticed. It provides a comprehensive view of the entire market landscape in seconds.
What is the difference between a point anomaly and a contextual anomaly in trading?
A point anomaly is a singular spike, like a sudden volume surge. A contextual anomaly is a move that is normal for the market but weird for the specific stock. For example, a 5% move in a utility stock during a flat market is a contextual outlier. AI-powered stock anomaly detection categorizes these to help you determine if a move is random noise or a strategic sector rotation.
Does TickerAI provide the actual trade execution or just the signals?
TickerAI focuses exclusively on opportunity discovery and does not provide brokerage execution services. The platform delivers real-time alerts, curated swing trade setups, and smart watchlists. You receive the high-speed intelligence needed to make informed decisions. The actual execution of the trade remains under your control through your preferred brokerage. This separation ensures the platform remains a dedicated, unbiased scout for market alpha.


