

A compelling investment thesis needs more than a persuasive story; it needs evidence you can test. Becoming a data-driven investor means using relevant market, company, and portfolio data to guide decisions, assess risk, and review whether a strategy holds up. The goal is not to replace judgment, but to make it more systematic.
You can feel informed while juggling scattered signals and still miss how a position fits your portfolio or what could undermine its thesis. A disciplined process brings those signals into focus and helps distinguish broad market exposure from risks tied to an individual holding.
This article explains how data-driven investing supports portfolio management, strategy backtesting, and resilient growth. You’ll learn to assess common-factor and company-specific risk, then turn your analysis into a repeatable investment process.
Key Takeaways
- Use reliable data and automation to make investment analysis more consistent and keep attention on decisions that matter.
- Assess how each holding contributes to portfolio exposure, and use that view to support more resilient growth.
- Backtest a strategy against historical data to examine its assumptions and understand how it behaves across market conditions.
- Separate common-factor exposure from company-specific risk to see what may be driving a position’s performance.
What is data-driven investing?
Data-driven investing uses company, market, and portfolio information to test decisions. For example, compare a company’s revenue trends with its share-price movements before assessing the stock.
Investment Technology and Automation
Investment technology collects, organizes, and analyzes information so you can follow a consistent process. A workflow might import company filings, flag changes in revenue, and add a stock to a review list when it meets defined criteria.
Automation also reduces repetitive work. Investors using relationship insights can save more than 180 hours per person annually by automating contact and deal data entry. For an individual investor, the practical lesson is to automate repeatable tasks, then reserve judgment for interpreting results and deciding what deserves attention.
Build the workflow step by step: define the question, identify relevant data, set a review trigger, and check the resulting signal. A price alert, for example, can prompt a review without making the buy-or-sell decision for you.
Useful Financial Data and Metrics
For stock evaluation, combine financial statements with market data. Revenue growth and operating margins describe business performance; cash flow and debt add context about financial capacity. Valuation measures such as price-to-earnings compare a share price with reported earnings. Consider each metric alongside its trend and the company’s business model.
Use a consistent comparison. For example, compare a retailer’s margins and cash flow across reporting periods, then assess its valuation against its own earnings history. One ratio can hide changes in profitability or debt, so record the metric, period, and source together.
In the U.S., securities regulations govern disclosures, trading, and the handling of material nonpublic information. Tax rules affect how realized gains, dividends, and losses are treated. The applicable tax treatment depends on the account, asset, and transaction.
Analysis Methods and Alternative Data
Fundamental analysis examines a company’s business and financial condition through measures such as revenue, earnings, cash flow, and debt. Technical analysis studies market behavior through price and trading-volume patterns. You can use fundamentals to form a thesis, then consider technical signals when examining timing and momentum.
Alternative data adds information beyond standard financial statements and market prices. Examples include product reviews, web traffic, and store activity, when relevant and reliable. Treat these as evidence to test, not as conclusions: compare them with reported results, check the period they cover, and consider whether they measure the company directly or only serve as a proxy.
Tie each method to a decision. A change in web traffic, for instance, may prompt closer review of reported sales, while a price trend may suggest that market sentiment has shifted. Record your original thesis and the evidence that would challenge it.
Portfolio management and resilient growth
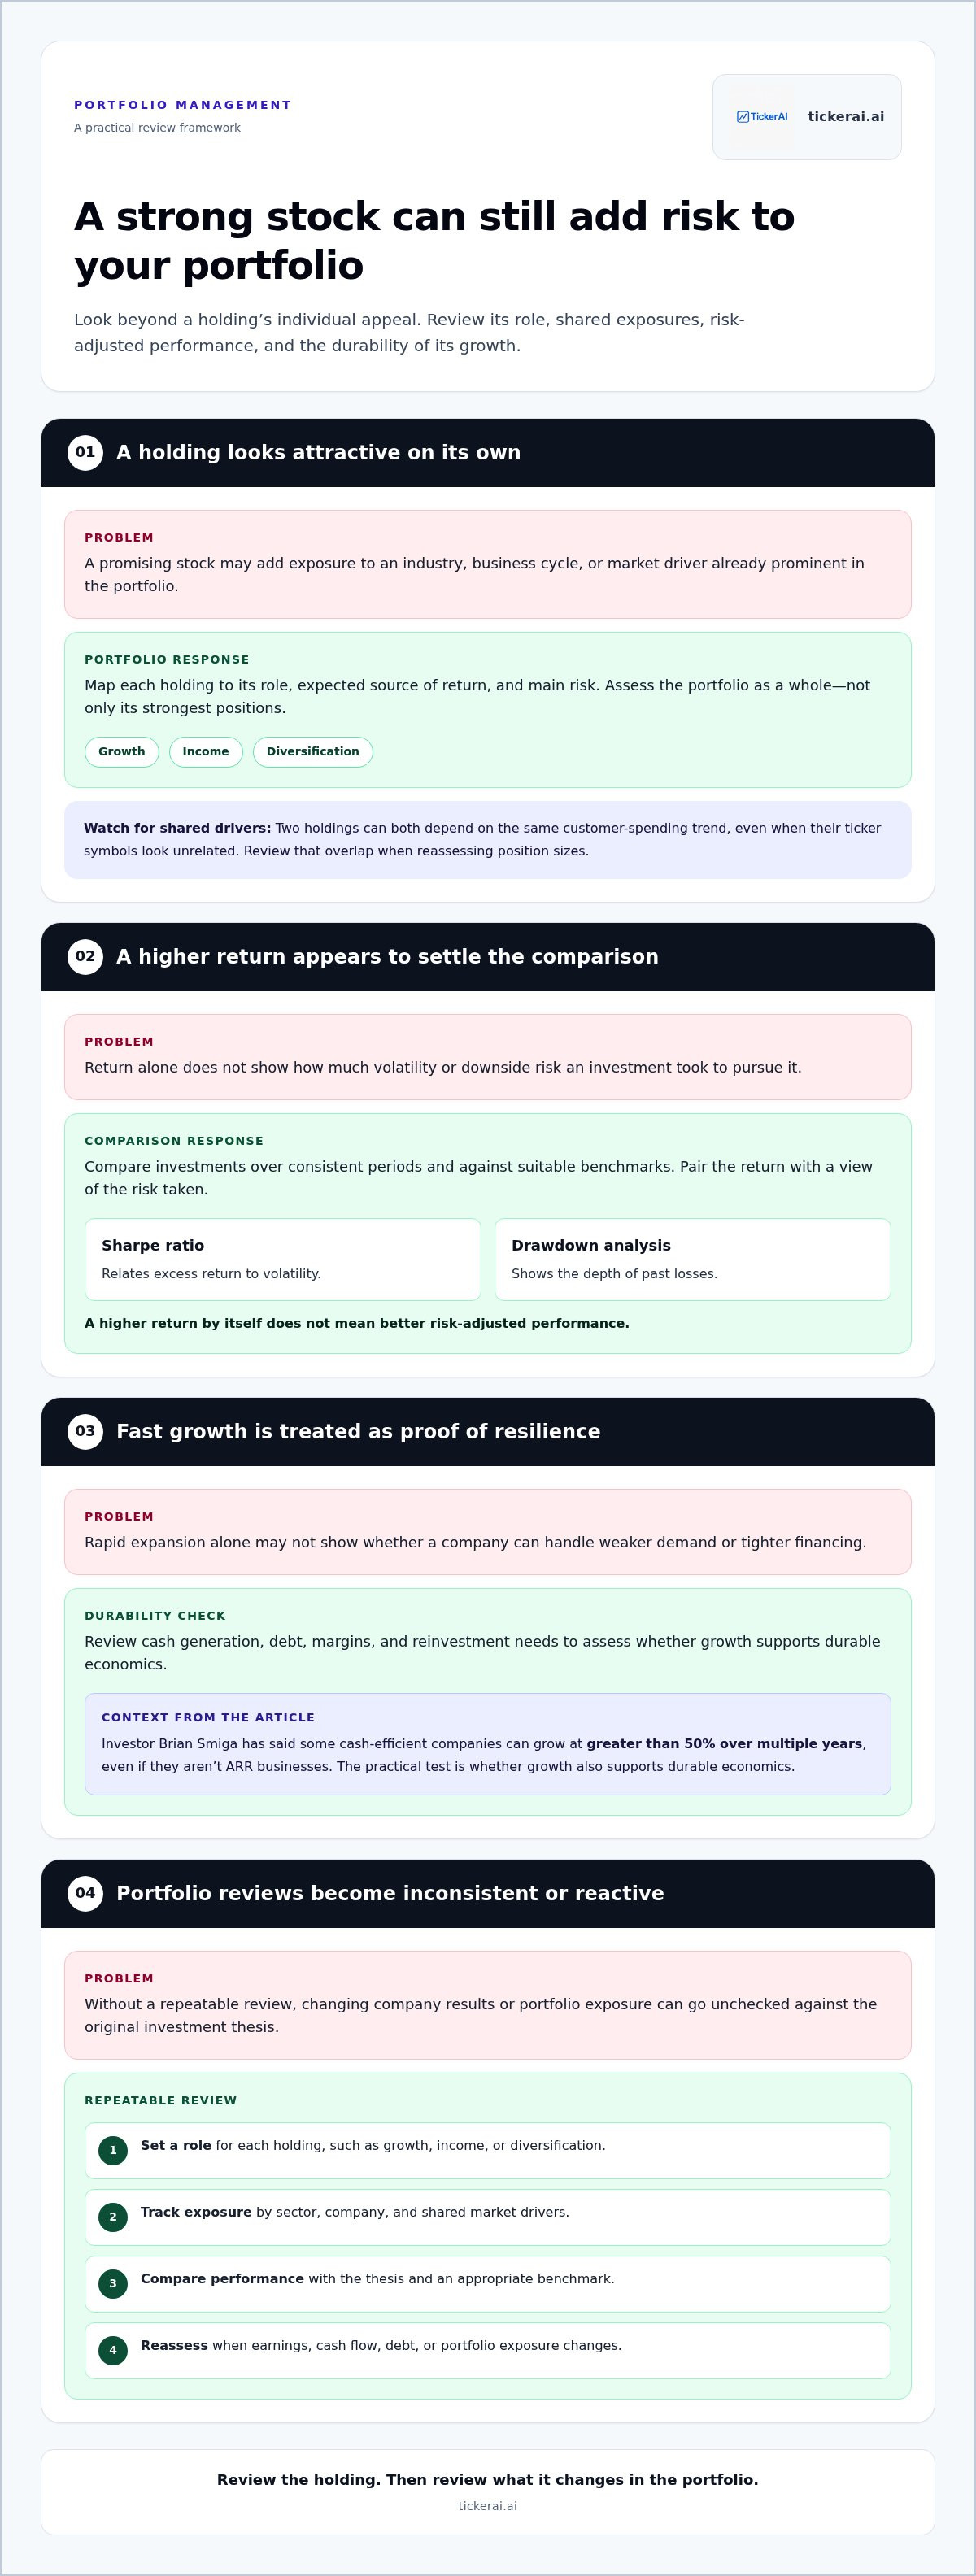
Portfolio management brings individual investment decisions into one coordinated allocation. A stock may look attractive on its own yet add exposure to an industry, business cycle, or market driver already prominent in your portfolio. Map each holding to its role, expected source of return, and main risk. Then assess the portfolio as a whole, not just its strongest positions.
To compare risk-adjusted returns, consider each investment’s return alongside the volatility or downside risk taken to pursue it. The Sharpe ratio relates excess return to volatility, while drawdown analysis shows the depth of past losses. Compare investments over consistent periods and against suitable benchmarks; a higher return alone does not mean better risk-adjusted performance.
Resilient growth depends on more than rapid expansion. Cash generation, debt, margins, and reinvestment needs help reveal whether growth can withstand weaker demand or tighter financing. Alpha Partners investor Brian Smiga has said some cash-efficient companies can grow at greater than 50% over multiple years, even if they aren’t ARR businesses. The practical test is whether growth also supports durable economics.
Use a repeatable review process to keep portfolio decisions grounded in evidence:
- Set a target role for each holding, such as growth, income, or diversification.
- Track exposure by sector, company, and shared market drivers.
- Compare actual performance with the thesis and an appropriate benchmark.
- Reassess when earnings, cash flow, debt, or portfolio exposure changes.
For example, two holdings may depend on the same customer-spending trend, even if their ticker symbols make them look unrelated. Reviewing that shared exposure can prompt you to reassess position sizes before the portfolio becomes more dependent on one outcome. Analytics can also help investment firms manage risk, raise assets, or onboard asset classes. A disciplined portfolio review connects these signals to specific allocation decisions.
Backtesting investment strategies
Beginners can build a strategy by defining an investment goal, choosing measurable signals, and writing clear entry and exit rules. For example, a rule could trigger a review when a company’s revenue trend changes, rather than relying on a vague impression. If you’re becoming a data-driven investor, ask whether someone else could follow your rules consistently.
Backtesting applies your rules to historical data to see how they would have performed. Before running a test, specify the assets, data period, signal, and portfolio decisions. Then compare the simulated results with your original goal. A strategy designed for long-term growth needs different evaluation criteria from one focused on short-term price movements.
Keep the test practical and controlled:
- Write the rules in plain language, including what would invalidate the thesis.
- Choose historical data that matches the assets and signals the strategy uses.
- Account for trading costs and the timing of information in the simulation.
- Review returns, volatility, drawdowns, and how often the rules triggered.
For example, a rule based on quarterly earnings must use the information only after its actual release. Feeding the model figures before investors could have accessed them creates look-ahead bias. A test that includes only companies still trading today may also exclude failed businesses, making past results look stronger than the strategy could have delivered.
Separate the data used to shape a strategy from the data used to evaluate it. If the same historical period drives both rule selection and performance claims, the strategy may simply fit past noise. Test unchanged rules on a later period, then examine whether results depend heavily on one company, market phase, or signal. Becoming a data-driven investor also means recording assumptions before reviewing results, rather than adjusting rules afterward to fit them.
A backtest is a diagnostic, not a forecast. Record each version of your rules and the reason for every change. If a strategy performs well only under a narrow set of assumptions, revisit the thesis before relying on its historical record.
Common-factor and idiosyncratic risk
Portfolio risk has two useful dimensions: shared market drivers and company-specific events. Common-factor risk affects securities through forces such as interest rates, inflation, or sector exposure. Idiosyncratic risk comes from developments tied to one business, such as a product delay or management change. Separating the two helps explain why holdings move together or diverge.
For example, a portfolio of several technology companies may look diversified by ticker yet remain sensitive to interest rates and investor demand for growth stocks. Factor analysis can reveal this shared exposure. By contrast, a production shutdown affecting one company is primarily idiosyncratic. Review both the underlying market drivers and each holding’s specific business risks.
Models estimate these exposures using historical relationships, but their inputs and assumptions matter. A model trained on stable markets may misread correlations when conditions shift. Incomplete company data, outdated classifications, or an overfit strategy can also produce misleading signals. Treat model output as a diagnostic: inspect the data period, variables, and assumptions behind each result.
Use a repeatable risk review:
- Group holdings by shared drivers, such as sector, interest-rate sensitivity, or commodity exposure.
- Identify company-specific vulnerabilities, including customer concentration or dependence on one product.
- Compare model estimates with actual portfolio behavior during different market conditions.
- Investigate sharp changes in exposure before adjusting a position.
For instance, if several holdings fall together after an interest-rate change, shared factor exposure may explain more than separate company news. If one stock drops after an earnings report while its peers remain steady, investigate its company-specific results. This distinction supports more targeted decisions than treating every loss as the same kind of risk.
Algorithmic investing can amplify bad inputs, miss unusual events, or mistake historical patterns for durable relationships. Check data quality, test assumptions, and retain human review for decisions the model cannot explain. To explore data-led ideas for your investment research, review long-term investment ideas.
TickerAI: AI Stock Opportunity Discovery
TickerAI helps investors surface stock opportunities through AI Stock Opportunity Discovery, curated Swing Trade Setups, Smart Watchlist & Alerts, and Long-Term Investment Ideas. It can support your research workflow when you want a focused stream of ideas to assess against your own criteria, portfolio exposure, and risk analysis.
Use platform ideas as inputs to your process, not substitutes for it. Review the underlying thesis, compare signals with company and market data, and decide whether an opportunity aligns with your investment goals. Watchlists and alerts can help organize candidates for review; long-term ideas can support research beyond short-term market movements.
Explore TickerAI’s investment research offerings by visiting tickerai.ai.
Make your next investment decision more deliberate
Becoming a data-driven investor is an ongoing practice: set a clear decision process, record why you act, and revisit the evidence as conditions change. The next step is to apply that discipline to a real research question instead of waiting for a perfect model or complete certainty.
TickerAI supports your research with AI Stock Opportunity Discovery, Swing Trade Setups, and Smart Watchlist & Alerts. Use these tools to surface candidates and organize your review, then assess each idea against your objectives and risk criteria. The analysis remains yours; a defined process helps make each decision more consistent.
Ready to explore how TickerAI fits your investing workflow? Contact TickerAI to discuss investing. Start with one clear question, evaluate the evidence, and build your process from there.
Frequently Asked Questions
What are the best tools and platforms for investment research and data analysis?
Build a research stack around your decisions: use company filings and financial statements to analyze businesses, historical price and volume data to study market behavior, and a portfolio tracker to review exposure. TickerAI can provide a starting point for idea discovery. Examine the underlying evidence and decide whether each candidate fits your research criteria. Prioritize reliable coverage, clear timestamps, and comparable data.
How do you test an investment strategy with historical data without overfitting?
Keep your rules focused, and don’t choose a strategy solely because it produced the strongest historical result. Test whether small parameter changes materially affect performance, and log every version you examine. Compare results with a simple benchmark. If performance collapses after a minor adjustment, the strategy may be capturing historical noise rather than a durable market pattern.
What U.S. regulations and tax rules affect data-driven investing?
In the U.S., securities regulations govern disclosures, trading, and the handling of material nonpublic information. Tax rules affect the treatment of realized gains, dividends, and losses, which depends on the account, asset, and transaction.


