

A strong AI trading result isn’t a spectacular daily win. A return of 2% to 4% per month with controlled drawdown is a strong result for an AI trading strategy. Setting realistic expectations for AI trading means weighing returns against volatility and the risk taken to produce them.
AI tools can surface potential market opportunities, but a signal is not the same as a reliable return. Chart patterns can fail, position size can magnify losses as well as gains, and backtesting results may not carry over to live trading. This guide explains how to assess these factors without relying on headline returns alone. You’ll learn how volatility shapes performance, what chart analysis can and can’t tell you, why position sizing matters, and how gradual scaling can help you evaluate a strategy in live conditions.
Key Takeaways
- Judge AI performance by drawdowns and day-to-day swings, not returns alone; volatility can quickly change the risk profile.
- Use chart signals as inputs to a tested strategy, not as stand-alone predictions of future price action.
- Size positions around the losses you can tolerate, since leverage can amplify both gains and drawdowns.
- Evaluate a strategy in live conditions with limited exposure before scaling, so execution and risk behavior can inform your next move.
Risks of large daily return volatility
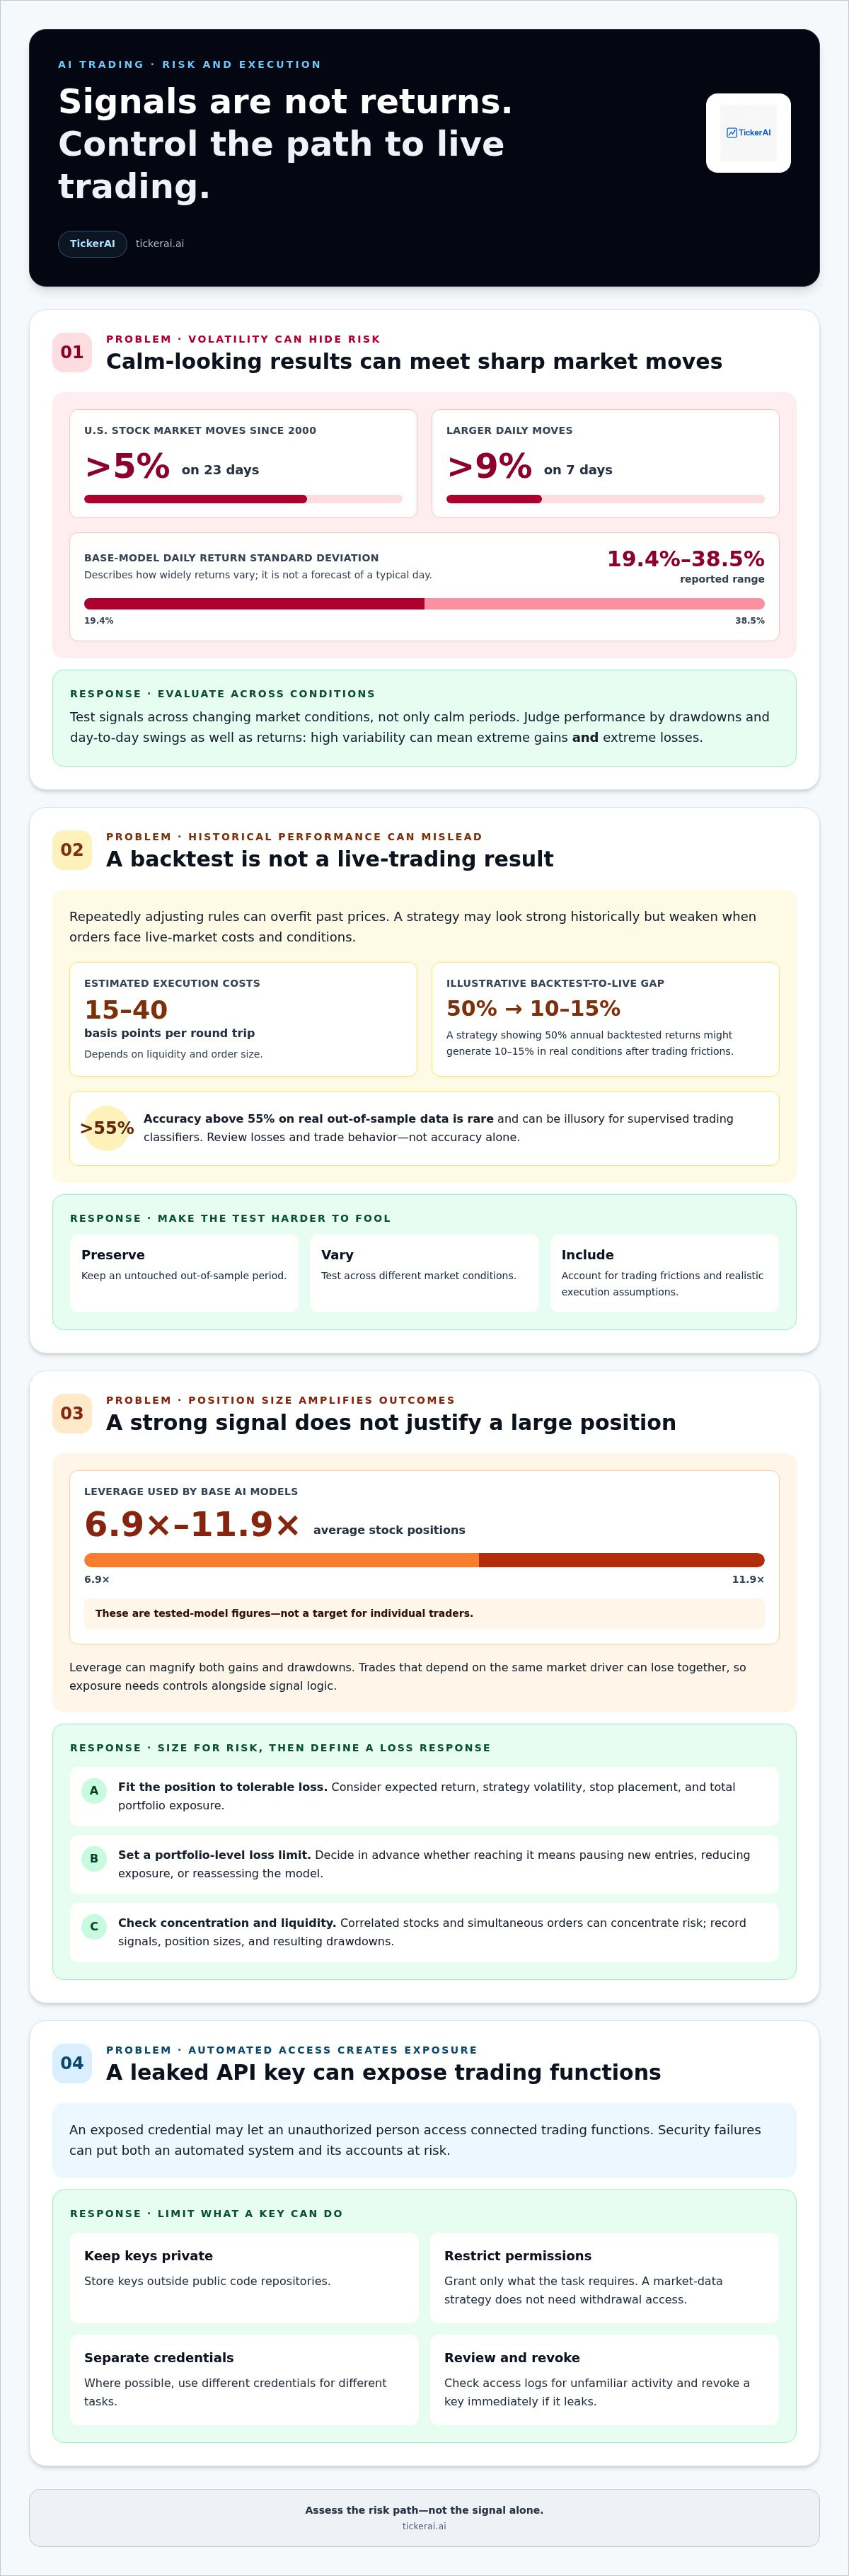
Daily volatility can make a promising strategy look reliable until sharp losses arrive. The US stock market moved by more than 5% on 23 days since 2000, and by more than 9% on seven days. In base-model tests, AI models’ daily return standard deviations ranged from 19.4% to 38.5%. Standard deviation describes how widely returns vary; it isn’t a forecast of a typical day. A high reading means gains and losses may both be extreme. Evaluate signals across changing market conditions, not just calm periods.
Security failures can put an automated system and connected accounts at risk. An exposed API key may let an unauthorized person access trading functions. Store keys outside public code repositories, restrict permissions to what the task requires, and revoke a key immediately if it leaks. For example, a strategy that needs market data does not need withdrawal access. Where possible, use separate credentials for different tasks and review access logs for unfamiliar activity. These controls can limit the damage a compromised key causes.
Claims of effortless passive income overlook execution and changing market conditions. A crypto signal may arrive during a rapid price move, while liquidity, spreads, and order handling affect the fill. An exchange outage or delayed data feed can also interrupt execution, even when the model generates a valid signal. Treat projected returns as estimates based on specific assumptions. Check whether results account for fees, slippage, and losing periods. A smooth backtest curve can conceal volatility that emerges when orders meet live markets.
Operational and systemic risks can compound: several strategies may rely on similar data or react to the same event, leading to correlated losses. Regulatory and ethical risks matter too. Rules vary by jurisdiction, and automated decisions can raise concerns about transparency, data quality, or unfair outcomes. Document the model’s inputs and how its signals affect orders. Keep records in plain language and review them after unexpected trades. Clear logs help show whether a problem came from the data, model logic, access security, or execution.
Chart analysis and trading algorithms
AI models process market data and generate signals, but those signals are not guaranteed forecasts. Algorithmic strategies use defined entry and exit rules to seek opportunities, while index investing tracks a market benchmark. Human-managed trading relies on a person’s analysis and decisions. AI can apply rules consistently, while people can interpret context a model may miss. Setting realistic expectations for AI trading means weighing these different strengths, not assuming automation will deliver better returns.
Backtesting estimates how a strategy might have behaved using historical prices. To limit overfitting, keep some data out of model development, test across varied market conditions, and account for trading frictions. Repeated strategy tweaks can tune rules to past prices instead of revealing predictive power. Accuracy above 55% on real out-of-sample data is rare and can be illusory for supervised trading classifiers. Review losses and trade behavior, not accuracy alone. This method supports setting realistic expectations for AI trading by testing whether signals hold beyond the development data.
AI trading software and data costs depend on the tools and datasets used. Real execution costs are estimated at 15-40 basis points per round trip, depending on liquidity and order size. Include these frictions when evaluating returns: a strategy showing 50% annual backtested returns might generate 10-15% returns in real conditions after trading frictions.
There’s no single required amount of data for building and testing a strategy. Data quality, frequency, and coverage of different market regimes matter. Historical stock-market data spans more than 100 years, but a model needs relevant, correctly aligned inputs. Starting with a focused dataset can make errors easier to identify.
To backtest without overfitting, define the method first, preserve an untouched out-of-sample period, and avoid repeatedly adjusting rules to improve historical results. Then use realistic execution assumptions. A chart pattern that works only in one historical window is weak evidence of a durable trading strategy.
Position sizing and drawdown limits
Position size connects a model’s signal to the amount of capital at risk. The Merton share rule expresses optimal volatility as the Sharpe ratio divided by the investor’s coefficient of risk aversion. In practice, traders should consider both expected return and the loss they can tolerate. A strong signal alone does not justify a large position. The strategy’s volatility, stop placement, and portfolio exposure all help determine a size that fits its risk profile.
Leverage can make small price movements produce outsized changes in account value. Base AI models used average stock positions ranging from 6.9x to 11.9x leverage. These figures describe tested models, not a target for individual traders. Before using leverage, examine how positions overlap: several automated trades may depend on the same market driver. If sentiment shifts or a shared data source changes, those positions can lose together. Algorithmic trading needs exposure controls alongside signal logic.
A drawdown is the decline from a portfolio peak to a later value. Set a portfolio-level loss limit, then decide in advance what to do if it is reached: pause new entries, reduce exposure, or reassess the model. For example, if several consecutive trades weaken the account, review whether the losses stem from market conditions, execution, or a faulty signal. A defined response helps prevent automated orders from continuing unchanged while the strategy’s assumptions are under pressure.
Position limits should reflect liquidity and concentration as well. A model may generate valid signals across correlated stocks, yet simultaneous orders can concentrate risk in one sector. Review exposure by asset and strategy, then test how losses might interact during adverse events. Record each signal, its position size, and the resulting drawdown. This helps distinguish a model problem from ordinary variation. Sizing is part of the trading method, not a final adjustment after analysis.
Starting with small quantities and scaling gradually
Small-scale live testing shows how a machine-learning strategy behaves beyond historical data. Start with exposure small enough that a losing trade will not disrupt your broader plan. Track whether actual fills, timing, and liquidity match the model’s assumptions. For example, compare each signal with the price at which the broker executes. This provides practical insight into how the system handles live conditions, not just simulated ones.
Scale only after reviewing a meaningful range of trades and market conditions. A short winning streak may reflect favorable timing rather than durable performance. Record each trade’s entry, exit, slippage, and reason for taking the signal. Then compare live outcomes with test results. If execution differs, identify whether spreads, delayed data, order types, or model behavior caused the gap before increasing exposure.
Set clear criteria for each increase. First, confirm the system follows its rules. Next, assess whether losses remain within your limits. Then raise exposure in measured steps, reviewing results after each change. If signals weaken or losses cluster, hold the current size and investigate. Avoid changing the model and position size at the same time, since that makes it harder to identify what caused performance to change.
- Establish a baseline: record the strategy’s assumptions and intended risk before live deployment.
- Review execution: compare generated signals with broker fills and note material differences.
- Scale selectively: increase exposure only when observed performance and risk remain consistent with your rules.
Almost every live strategy encounters conditions that weren’t obvious during testing. Gradual scaling makes those conditions visible while exposure remains controlled. To apply this discipline to current market signals, review market opportunities with a defined evaluation process.
TickerAI: AI Stock Opportunity Discovery
TickerAI helps traders discover stock opportunities through AI Stock Opportunity Discovery, with Swing Trade Setups for short-term analysis and Long-Term Investment Ideas for broader horizons. Smart Watchlist & Alerts help organize tickers and track potential market movements, making it easier to review signals against your own risk limits and testing process.
Use these tools when you want a structured flow of ideas to evaluate, rather than treating model output as a return forecast. Compare each setup with your strategy, position-sizing rules, and tolerance for drawdowns. The final decision remains yours, guided by your objectives and approach to risk.
Explore TickerAI’s stock discovery tools at tickerai.ai.
Make Your Next Trading Decision Deliberate
Sound expectations come from a repeatable process, not a single standout result. Decide what evidence would justify continuing, adjusting, or stopping a strategy before trading begins. This helps keep market noise from changing your standards after every win or loss. As you gain experience, use each review to refine how you assess signals and risk. That is the practical value of setting realistic expectations for AI trading: making decisions with a clear framework instead of chasing an idealized return.
If you want a focused source of ideas to evaluate, TickerAI offers AI Stock Opportunity Discovery, Swing Trade Setups, and Smart Watchlist & Alerts. Use them as inputs to your own research and decision process, keeping your criteria central.
Contact TickerAI to discuss its AI trading tools and explore how its offerings fit into your approach. Stay measured, keep learning, and let disciplined decisions guide your next move.
Frequently Asked Questions
Best AI Trading Agents in 2026: Do They Actually Make Money?
Some AI trading systems may produce profitable results, but the label alone says nothing about performance. Compare how a system generates signals, handles losing periods, and performs beyond the data used to develop it. For example, a tool that identifies potential setups can help organize research, while a fully automated system also involves execution decisions. Judge its usefulness by its method and fit, not by promotional claims.
AI trading: the future of stock exchange trading?
AI is likely to remain one tool in stock-market analysis rather than replace every trading method. Models can scan large datasets and flag patterns quickly, while people set objectives, interpret context, and decide how to respond. A company announcement, for example, can change the meaning of a price pattern. In practice, automated analysis is likely to work alongside human oversight and clear risk controls.
AI trading: will trading with AI tools be worthwhile in 2026?
AI tools can be useful if they improve a specific part of your process, such as finding stocks to research or organizing watchlists. They are less useful if you expect software to remove uncertainty or make every decision for you. Define the task first, then assess whether the output is relevant and understandable. TickerAI provides stock opportunity discovery, watchlists, alerts, swing setups, and long-term ideas.
Do AIs Make Good Traders, and Do They Make Good Traders Better?
AI can support trading by processing information consistently, but it does not independently understand every market context. An experienced trader may use a model to surface a ticker worth examining, then review company developments and portfolio fit. A newer trader can use structured signals to focus research, but still needs clear decision criteria. The benefit depends on how carefully the output is evaluated before action.
How does AI trading work?
AI trading systems process inputs such as historical prices and other market data, then use programmed rules or trained models to identify patterns. A system may produce a signal, such as a potential entry or trend change. What happens next depends on the tool: some present information for a person to assess, while others may connect signals to automated orders. TickerAI focuses on discovery, ideas, watchlists, and alerts.
What can AI trading realistically do, and what are its limitations?
AI can scan information, rank potential opportunities, and surface patterns that might otherwise take longer to review. Its output depends on the data and model assumptions, so errors, unusual events, or changing market behavior can weaken a signal. AI also cannot determine whether a trade suits your personal goals. Use its output as an input to analysis, then make decisions within a defined strategy and risk framework.


