

The best market analysis tools aren’t automatically the ones with the most indicators. Market analysis uses information such as price action, company fundamentals, and market news to assess conditions and identify potential opportunities. A tool’s usefulness depends on the quality of its data and the methods it uses, so a long feature list alone doesn’t show how reliable its signals are.
Comparing platforms can be difficult because each emphasizes different data, workflows, and investing styles. Focus on practical differences: what the tool measures, how its features support your decisions, and whether its analysis fits your approach.
This guide explains what market analysis involves, compares popular tools by price, features, and accuracy, and shows how to match them to different investing styles. You’ll also find a framework for weighing limitations and choosing a setup that supports your research without mistaking an indicator for a decision.
Key Takeaways
- Start with your analysis objective: decide whether you need price action, company fundamentals, market news, or a combination.
- Compare charting tools by the indicators and alerts they support, then focus on the features that fit your workflow.
- Match your toolset to your investing style, using complementary sources for chart analysis, fundamental data, and market context.
- Assess accuracy through data quality and methodology, and treat technical signals as inputs to analysis rather than automatic decisions.
How Accurate are Technical Analysis Tools?
Accuracy depends on the data collected and the methodology applied. Start by defining the decision you need the tool to support.
For trend research, prioritize historical charts, price action, and volume. For company-level analysis, look for quantitative fundamentals; qualitative research may require different inputs. Then map the tool to your workflow: confirm it works with your existing systems, broker, and data feeds. Integration can reduce manual transfers, but mismatched timestamps or inconsistent symbols can distort analysis. Before connecting accounts or importing records, review data protection practices against the regulations relevant to your organization.
Visualization and Analytics
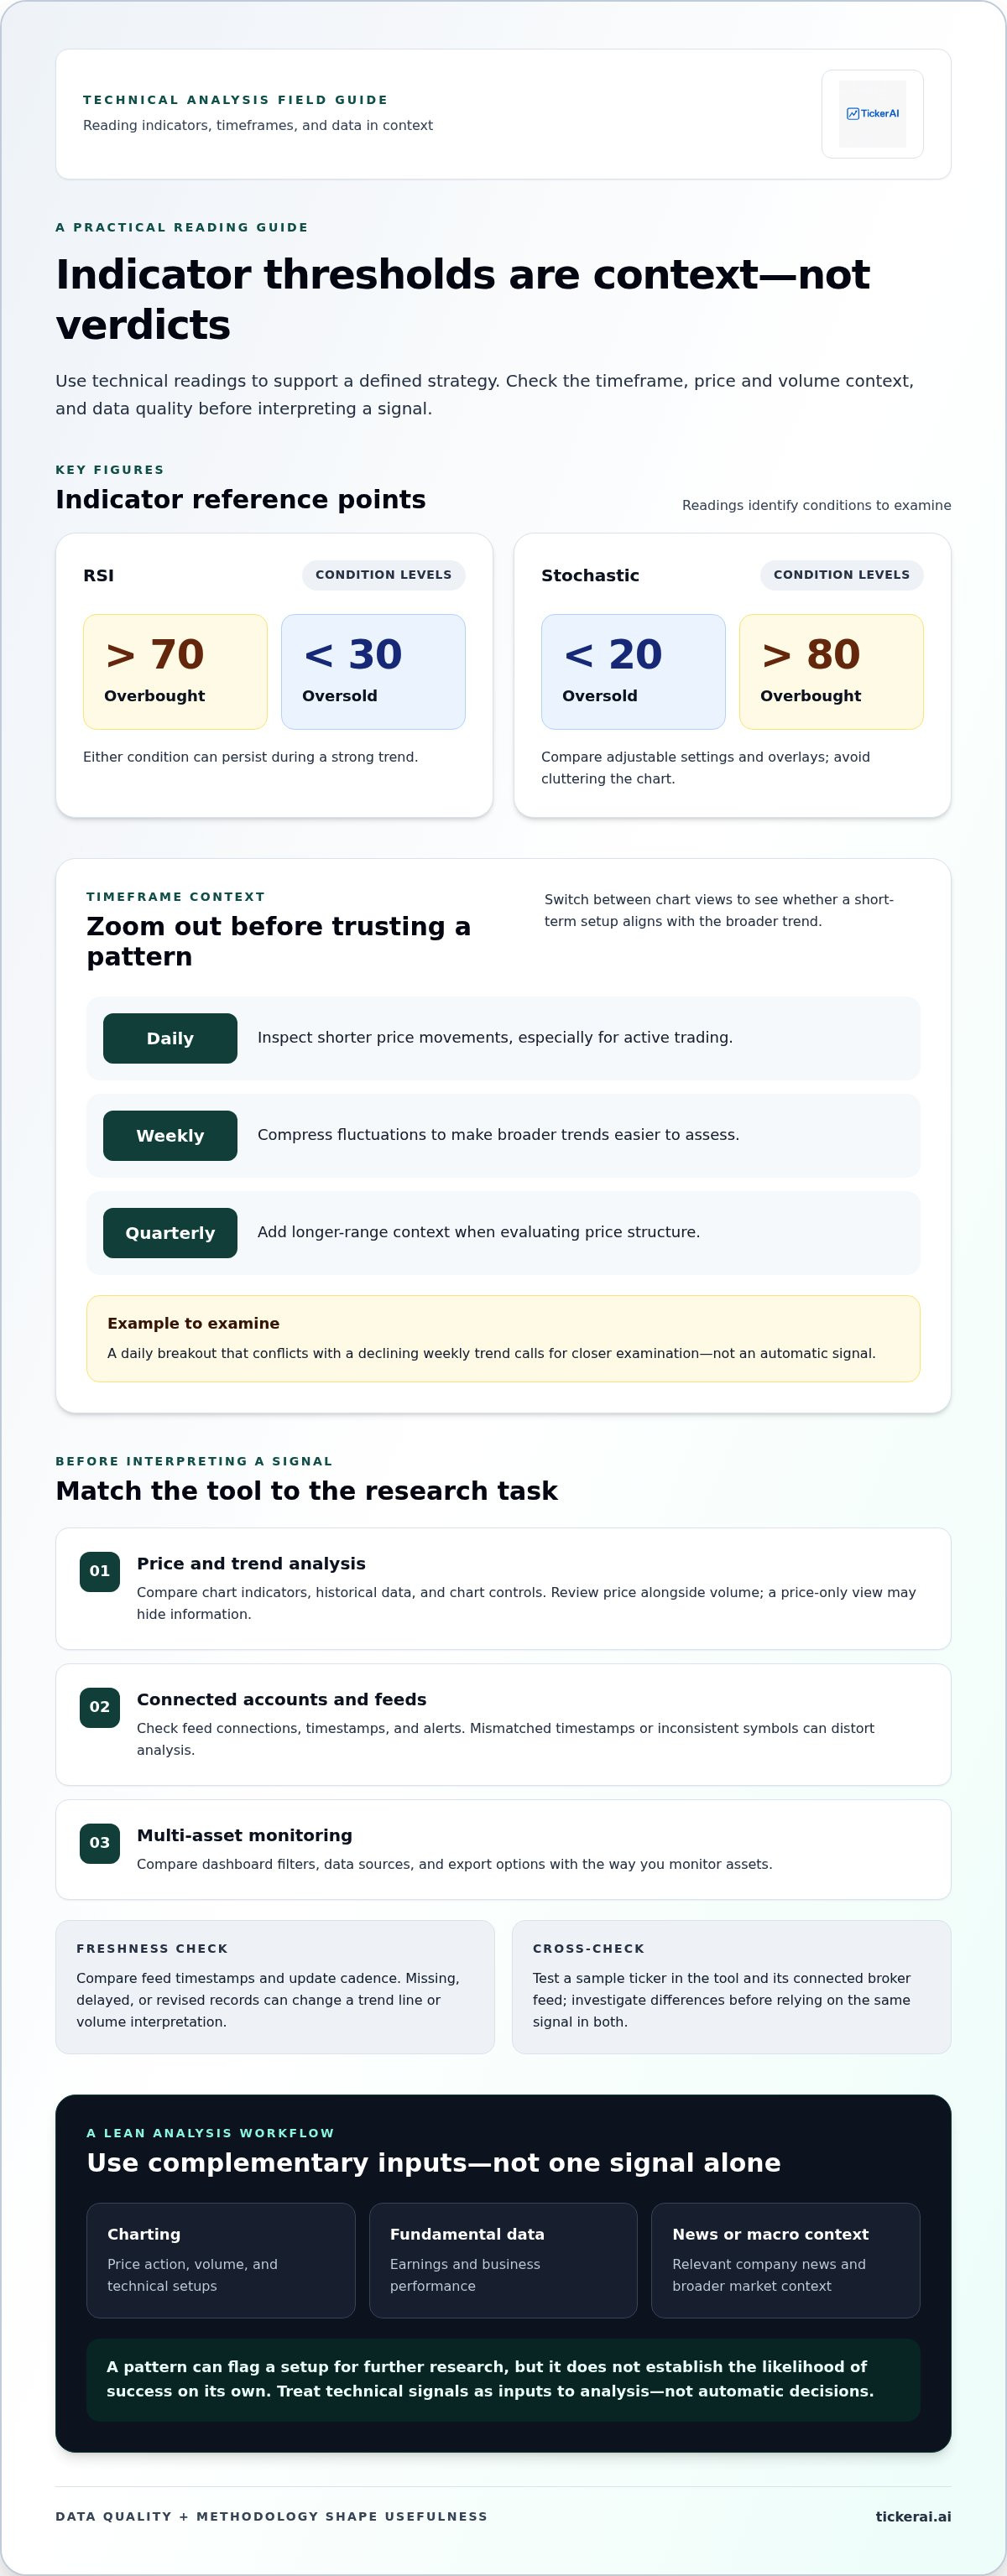
Visualization tools turn price, volume, and historical data into charts, dashboards, or comparable views. A charting interface helps you inspect a ticker and identify patterns; a dashboard can combine indicators or assets for broader monitoring. Compare chart types, filtering, and export options with your research task. For example, tracking volume alongside price can reveal information a price-only chart may hide.
Data Quality and Freshness
Freshness matters most when decisions depend on changing market conditions. Compare the timestamps and update cadence shown by each feed, then check whether historical records use consistent definitions. Missing observations, delayed updates, or revised data can change a trend line and the interpretation of volume. Test a sample ticker in the tool and its connected broker feed, and investigate differences before relying on the same signal in both systems.
| Tool option | Best fit | Key comparison criteria |
|---|---|---|
| Charting platform | Price and trend analysis | Indicators, history, chart controls |
| Broker-linked app | Integrated account workflow | Feed connection, timestamps, alerts |
| Analytics dashboard | Multi-asset monitoring | Filters, data sources, exports |
Choose a tool that matches your objective, data needs, and workflow, then validate its inputs before interpreting a signal.
Which Software/ App/ Website Provides Best Technical Analysis Tool?
For businesses in 2026, the best fit depends on charting, data coverage, and workflow needs. Features and use cases differ: free research options and popular US platforms range from brokerage charts to standalone software.
Technical Charting Features
Technical charting software displays price action and volume through candlestick, line, or bar charts. Compare platforms by how well they let you add patterns, save layouts, and screen securities without rebuilding the same analysis. Candlesticks show open, high, low, and close prices for each interval. A pattern can flag a setup for further research, but it doesn’t establish the likelihood of success on its own.
Chart Timeframes and Tools
Daily charts help active traders inspect shorter price movements; weekly views compress fluctuations and make broader trends easier to assess. Quarterly charts provide longer-range context for evaluating price structure. Switch between timeframes to see whether a short-term pattern aligns with the larger chart. For example, a daily breakout that conflicts with a declining weekly trend calls for closer examination, not an automatic signal.
Indicators and Customization
Indicators transform price and volume into measures that can support a defined strategy. RSI above 70 indicates an overbought condition, while RSI below 30 indicates an oversold condition; either can persist during a strong trend. Stochastic readings below 20 and above 80 mark oversold and overbought conditions, respectively. Compare software by adjustable settings, chart overlays, and whether indicators can be combined without cluttering the view.
Market Analysis Tools by Use Case
For business research, choose tools based on the question: charting software suits price analysis, while market research platforms support consumer and competitive research. Free options can help users explore charts and basic indicators; compare their data access and customization with paid workflows. In the United States, brokerage-integrated charts and standalone technical-analysis platforms serve distinct needs. Choose according to intended use, not popularity alone.
Matching analysis tools to investing styles
Start with your strategy, not the software. A short-term trader monitoring momentum needs technical charts, volume context, and timely alerts. A long-term investor assessing company fundamentals needs earnings data, business performance, and broader market context. The best market analysis tools for you are the ones that support decisions you actually make, not simply the ones with the most features.
Build a lean workflow around complementary tools: one for charting, one for fundamental data, and one for news or macro context. For example, a swing trader could use technical analysis to identify a setup, then review company news before evaluating it. A long-term investor might prioritize company data and market context, using charts to assess entry timing rather than drive the investment thesis.
Let measurable use guide your budget. List the tasks a tool supports, such as screening candidates, reviewing trends, or tracking a watchlist. Then record the time spent on those tasks before and after adding the tool. Assess whether it reduces manual research, surfaces relevant opportunities, or helps you apply your strategy consistently. A subscription adds value only when its features support decisions you actually make.
- Active trading: Prioritize technical charting, volume analysis, and configurable alerts for monitoring setups.
- Swing trading: Combine chart signals with company news to assess whether a short-term setup has relevant context.
- Long-term investing: Focus on fundamentals and broader market information, with charts as a secondary timing input.
- Mixed strategies: Separate workflows by objective, so short-term signals don’t override a long-term thesis.
Review your setup against your process regularly. If a feature goes unused or duplicates another source, remove it from the workflow. If a tool helps identify candidates but doesn’t support your next research step, pair it with a complementary source. Compare the best market analysis tools by strategy fit, practical usefulness, and how well they support decisions you can evaluate over time.
Accuracy of market analysis tools
Accuracy is not a fixed property of a platform. It depends on the input data, the analysis method, and how consistently a signal is applied. Chart-pattern setups have a reported success range of 50-70%, depending on market conditions and implementation. That range describes varied outcomes, not a forecast for any individual pattern or trade.
Define what “accurate” means before comparing tools. For a breakout strategy, measure how often a defined pattern reaches its target before its invalidation point. For a trend-following approach, assess whether the signal identifies sustained movement rather than short-lived price noise. Keep entry rules and evaluation methods consistent. Changing them between examples makes results difficult to compare.
Test signals against historical data, then examine how they behave in different market conditions. Include periods when a pattern performs poorly, not just clear examples that support it. Data quality matters: missing prices, inconsistent intervals, or delayed feeds can alter a chart and its apparent signal. Methodology matters too. A subjective pattern definition can produce different results between analysts, while fixed rules make comparisons more repeatable.
Give alerts a clear role. Set price, earnings, and news alerts around information that could change your analysis, and configure each trigger to fit your process. An alert marks a condition for review; it doesn’t verify the underlying insight. For example, a price alert can prompt a fresh chart review, while an earnings notification can direct your attention to company fundamentals.
Prefer tools that make their data and signal logic understandable. Advanced features add value when they help you test a specific strategy, not merely display more indicators. Record each signal, the conditions around it, and the outcome. This gives you a practical basis for refining your rules and identifying where a tool supports decisions reliably.
Use Smart Watchlist & Alerts to organize market signals for review within a consistent analysis process.
TickerAI: AI Stock Opportunity Discovery
TickerAI helps investors discover stock opportunities with AI Stock Opportunity Discovery. Use it when you want a structured stream of ideas to research alongside your own analysis, rather than another chart to interpret alone.
For shorter-term strategies, Swing Trade Setups and Smart Watchlist & Alerts help organize potential setups and track market signals. For longer horizons, Long-Term Investment Ideas offer another starting point for researching stocks that may fit your investment approach. These tools support discovery and monitoring; assess each idea against your own criteria before making a decision.
If you want to explore AI-powered stock discovery for your research workflow, visit TickerAI.
Put Your Analysis Workflow Into Action
Turn your research process into a repeatable workflow. Choose the information that informs your decisions, decide how you’ll review it, and record what changes your assessment. That discipline helps you judge whether the best market analysis tools support your approach or create extra noise.
If finding and tracking stock ideas is a gap in your process, TickerAI offers AI Stock Opportunity Discovery, Swing Trade Setups, and Smart Watchlist & Alerts. Use these tools alongside your independent research to organize potential opportunities and monitor signals for further review.
Assess each idea against your own criteria and decide what deserves deeper analysis. A focused workflow makes it easier to learn from your decisions and refine your process as market conditions change.
Contact TickerAI to discuss your analysis and explore a practical next step for your research workflow.
Frequently Asked Questions
What is market analysis?
Market analysis examines information about an asset, industry, or customer market to support a decision. For a stock, that might mean combining company earnings, sector developments, and price behavior to assess what could influence its outlook. The best market analysis tools help organize these inputs, but the right choice depends on what you’re evaluating. Separate company-specific evidence from broader market forces to see what may be driving a change.
How much do popular market analysis tools cost?
Costs vary with data access, analytical features, integrations, and billing model. Free versions may provide basic charts or screening, while paid plans can add advanced analytics or specialized feeds. For any paid tool, price depends on the use case; cost factors include the features, data access, and integrations required. Compare functionality with your workflow, not feature counts alone.
How accurate and reliable are market analysis tools and their data?
Reliability depends on whether a tool’s inputs and methods suit the question you’re testing. For example, a charting signal based on closing prices won’t answer a question about intraday movement. Compare displayed data with a separate source and note timestamps, missing records, and adjusted historical prices. Evaluate a signal using consistent entry and exit rules, including examples where it failed, to understand its performance in different conditions.
How do you choose and use a market analysis tool?
Choose among the best market analysis tools by naming the decision each must support, then testing that task in your research workflow. For example, screen for a company characteristic, review its earnings context, and save the result for later comparison. Check whether the tool exports usable records and whether its alerts can be tuned to meaningful events. Remove features that don’t inform a decision you can explain.
What are the limitations and privacy risks of market analysis tools?
Tools can mislead when data is incomplete, assumptions are hidden, or signals are treated as certain. Privacy risks can arise when an app requests account access or stores watchlists and research activity. Review permissions before connecting accounts, use only necessary access, and avoid uploading sensitive records without a clear reason. Keep a separate record of key assumptions so you can question an output rather than accept it automatically.


