

A trend reversal often starts with a change in how price behaves before the chart structure confirms it. To understand how to spot a market trend early, watch for repeated closes beyond a price channel, a break of the trend line, and momentum that supports the shift. Treat these as early signals, not proof of a reversal.
A dramatic price move can grab attention, but a single break may be noise. The stronger clue is what happens next: does price hold beyond the channel, and does momentum support the change?
This article explains how price acceptance, trend lines, and momentum work together to reveal emerging trends and possible reversals. You’ll learn what higher highs and higher lows indicate, how moving averages and momentum indicators add context, and why a broken trend line is a reason to reassess, not an automatic trade signal.
Key Takeaways
- Separate an early shift in price behavior from structural confirmation before interpreting a possible reversal.
- Use repeated closes beyond a distribution channel to assess whether acceptance is changing, not a brief move or wick.
- Read trend lines as dynamic support or resistance, and treat a break as a signal to reassess rather than an automatic trade.
- Combine momentum indicators with price structure to gauge whether a developing move has strength or may be losing force.
How do you spot a trend reversal early?
Assess a possible reversal by comparing price acceptance, market structure, volume, and momentum. An early warning is a reason to look closer, not confirmation of a new trend.
Early Warnings and Confirmed Structure Changes
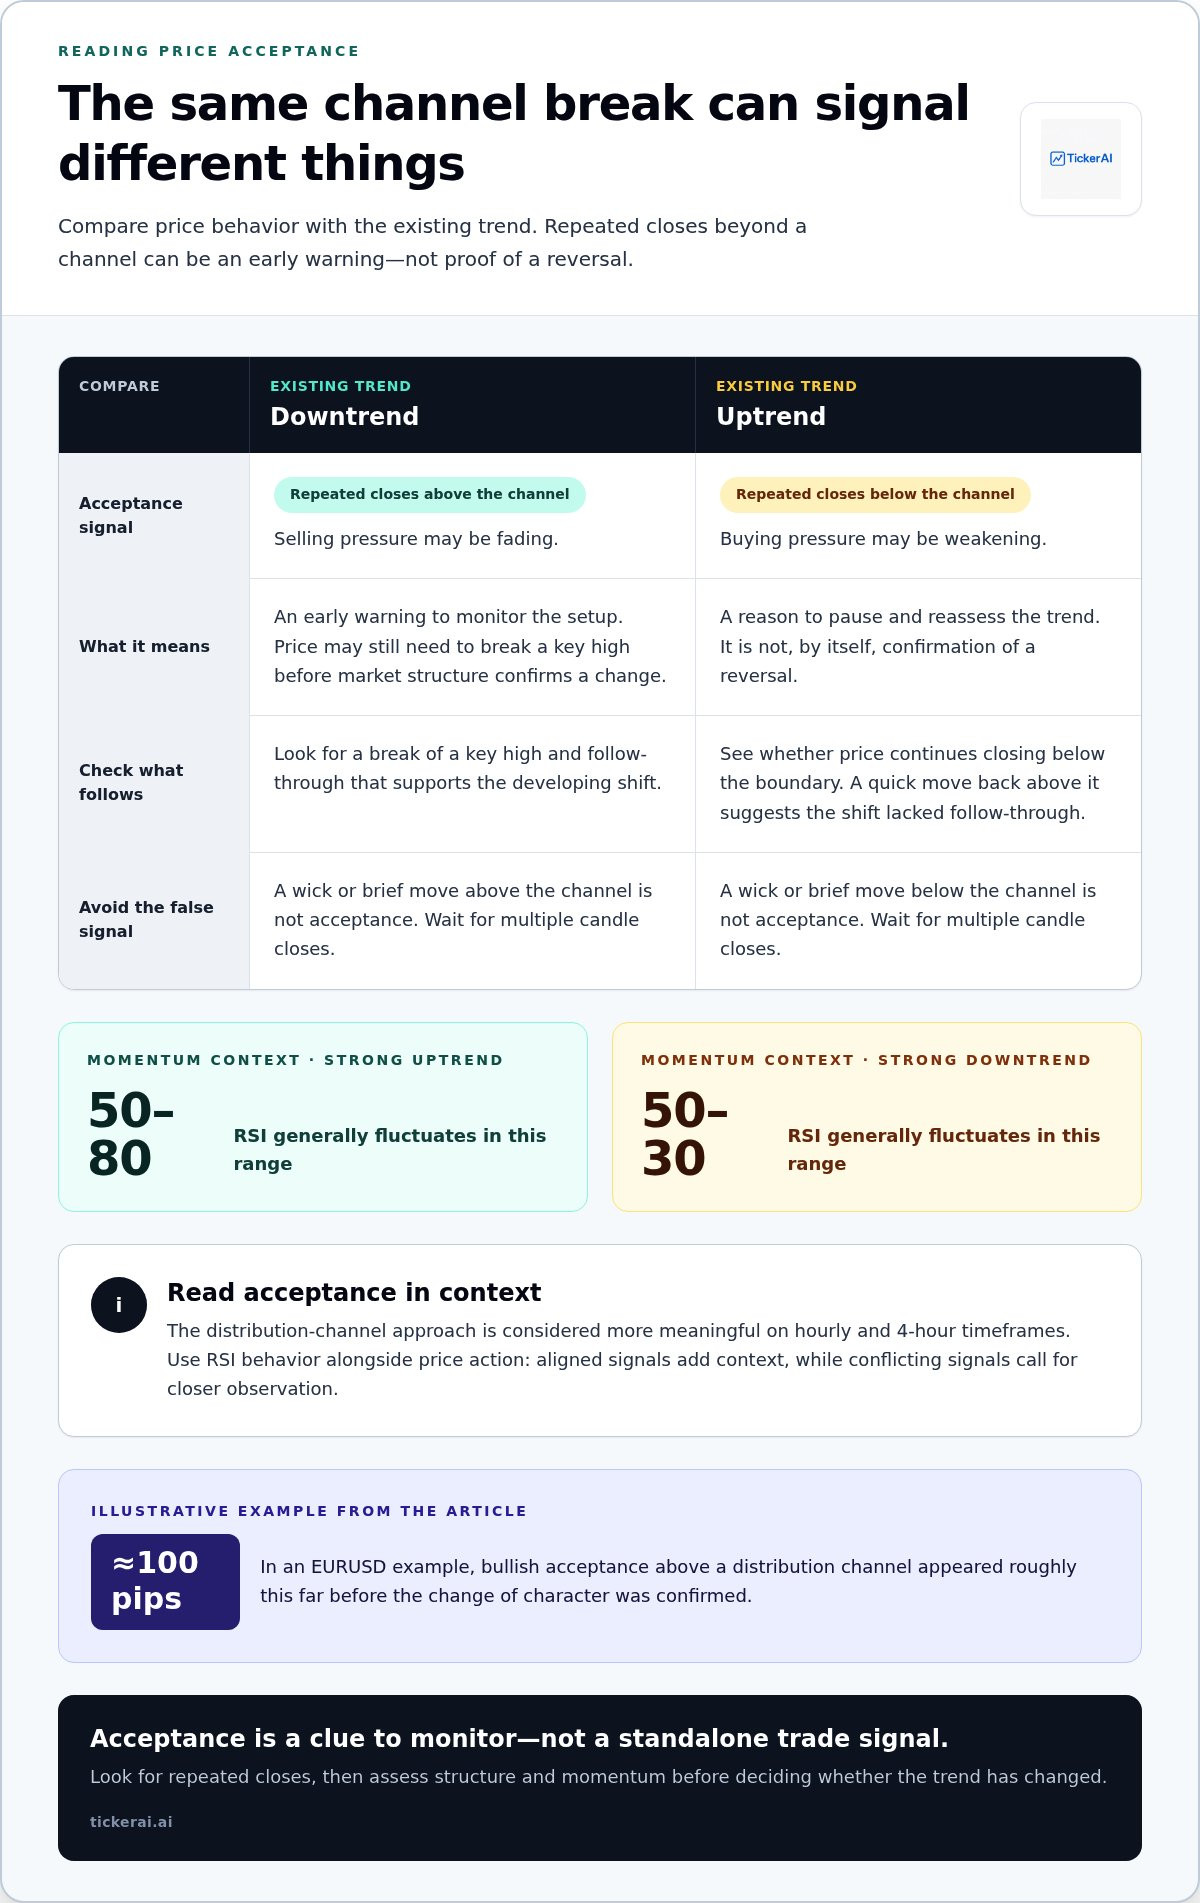
An early warning is a change in price behavior that appears before a key high or low breaks; a change of character is structural confirmation after that break. This distinction helps separate monitoring from treating a reversal as established. In an EURUSD example, bullish acceptance above a distribution channel appeared roughly 100 pips before the change of character was confirmed.
To spot a move before it becomes widely recognized, add stocks showing early signals to a watchlist, then wait for supporting evidence before changing your thesis. A broken trend line is a warning, not confirmation. False calls often result from mistaking a single wick for sustained acceptance, clinging to an existing bias, or overlooking price action that would disprove the idea.
Volume and Breakout Confirmation
Volume confirmation compares participation during a breakout with the activity behind ordinary price movement. A 2% stock move on exceptionally low volume is described as typical short-term noise, while a 2% drop on three times average daily volume indicates active institutional selling. These examples show why price direction alone can mislead.
Check whether price closes beyond a meaningful range and whether volume supports the move. A breakout that quickly falls back into its prior range has less confirmation than one that holds beyond it. On-Balance Volume adds context by subtracting the day’s volume when the close is below the previous day’s close.
RSI Confirmation and Divergence
The Relative Strength Index (RSI) compares average gains with average losses; its default calculation uses 14 periods. RSI divergence occurs when price makes a new high or low but the indicator fails to follow, flagging weakening momentum. A rapid RSI change is a reason to examine a possible major shift, not to assume one has occurred.
Compare RSI with price structure and volume before interpreting a signal. For example, falling RSI while prices rise suggests momentum is not keeping pace with the advance. That divergence can put a reversal on your radar, while a change in price behavior and a break below a key low provide further evidence.
Real-Time Trend Tracking Tools
Track developing trends with price charts, volume, trend lines, moving averages, and momentum indicators such as RSI. Together, they help you assess whether price is holding beyond a channel, whether a breakout is attracting participation, and whether momentum agrees. Combining these tools gives a more complete picture than relying on a single signal.
Set chart alerts around relevant price levels, then review closing behavior and volume instead of reacting to every intraday wick. Before acting, define what would invalidate your trend thesis. Individual indicators can lag or conflict with price; considering structure, participation, and momentum together gives you a more disciplined read.
Using acceptance in downtrends and uptrends
Acceptance means price holds beyond a channel through multiple candle closes. A wick or brief move outside the channel does not establish acceptance. This distinction helps you judge whether market behavior is shifting or merely testing a boundary. The same signal can mean different things depending on the direction of the existing trend.
During a downtrend, repeated closes above the channel suggest selling pressure may be fading. Treat this as an early warning, not a reason to trade immediately against the prevailing move. Price may still need to break a key high before the structure confirms a change. Acceptance can appear well before that shift, giving you time to monitor the setup rather than react to one candle.
In an uptrend, acceptance below the channel can indicate weakening buying pressure. Pause and reassess the trend rather than entering a reversal trade immediately. Check whether price continues to close below the boundary and whether subsequent price action supports the signal. A quick move back above the channel suggests the apparent shift lacked follow-through.
Use the channel alongside momentum for context. In strong uptrends, RSI generally fluctuates between 50 and 80; in strong downtrends, it generally fluctuates between 50 and 30. A change in acceptance that aligns with RSI behavior adds context, while conflicting signals call for closer observation. This distribution-channel approach is considered more meaningful on hourly and 4-hour timeframes. To keep developing setups organized, use a market opportunity watchlist alongside your chart analysis.
Using trend lines to identify support and resistance
Trend lines connect two or more price points and extend forward as potential support or resistance. For emerging consumer or industry trends, compare company sales disclosures with demand signals such as search interest and inventory changes. On stock charts, price pivots show where buying or selling has repeatedly influenced direction.
Draw an uptrend line through at least two low points, with the second low higher than the first. The rising line can act as support: while price stays above it, the uptrend remains intact. Extend the line forward and watch whether later pullbacks approach it and recover. Repeated reactions make it a more useful reference, but each touch is not a forecast.
For a downtrend line, connect at least two high points, with the second high lower than the first. The descending line can act as resistance, where rallies meet selling pressure. If price stays below it, the pattern remains consistent with lower highs. A clear move above the line can warn that selling pressure is weakening, but does not confirm a reversal on its own.
Placement matters. Use distinct swing lows or highs rather than forcing a line through minor fluctuations. Evaluate it on the same chart timeframe, since switching between daily and hourly views can make different pivots appear significant. A trend line is a visual guide, not a fixed market barrier. Price may briefly cross it and return, so assess closing behavior and the surrounding structure.
For example, imagine a stock rises from a clear low, pulls back to a higher low, then advances again. Connect those lows and extend the line. If a later decline closes below it, reassess whether support has failed and whether subsequent price action forms lower highs or lower lows. That sequence offers more context than the initial break alone.
Use trend lines to identify the price level that would challenge your current view. A break below an uptrend line is a reason to review the structure, not an automatic sell signal. A break above a downtrend line also warrants attention, while later higher lows can strengthen the case for a changing trend.
Trend-following and market momentum
Trend-following focuses on persistent direction, while momentum measures the force behind price movement. An uptrend forms higher highs and higher lows; a downtrend forms lower highs and lower lows. Price direction reveals structure, while momentum helps you assess whether buying or selling pressure is strengthening or fading.
Search trends, social media discussion, and news can reveal shifts in attention around a company or industry. Rising search interest or sustained discussion may flag a developing theme, while news can point to a catalyst. Treat these as context, not proof of market momentum. Compare attention with price structure and technical indicators before drawing a conclusion.
Moving averages smooth price data to expose direction. A 20-day moving average averages the previous 20 closing prices. Traders also use 50-day and 200-day moving averages to assess stock market trends. A 50-day exponential moving average crossing above a 200-day exponential moving average can serve as a potential long-entry signal. It confirms a pattern only after prices establish direction around those averages.
MACD adds a momentum comparison: its line is the difference between the 12-period EMA and 26-period EMA. Its signal line is a subsequent 9-period EMA of the MACD line. A bullish crossover can indicate strengthening upward momentum; a bearish crossover can signal weakening momentum. The sequence shows how momentum signals can change as price develops.
Match the indicator to the horizon. Fidelity describes intermediate trends as lasting 1 to 3 months, while minor trends last less than 1 month. Compare the relevant moving averages, MACD direction, and price structure on the same timeframe. To scan for developing stock setups, put AI stock opportunity discovery to work alongside your own analysis.
TickerAI: AI Stock Opportunity Discovery
When chart signals point to developing opportunities, TickerAI can help you monitor a broader watchlist. Its AI Stock Opportunity Discovery brings potential stock movements into focus, while Smart Watchlist & Alerts help you track tickers as conditions evolve.
For shorter-term moves, Swing Trade Setups offer ideas to assess alongside your own trend-line and momentum analysis. Long-Term Investment Ideas provide a different perspective when evaluating longer horizons. These tools support research and monitoring; they do not replace your judgment or guarantee an outcome.
Explore TickerAI at tickerai.ai to see how its stock discovery tools fit your market research.
Turn market signals into a sharper watchlist
Early trend analysis is most useful when it guides what you monitor next. Set a clear thesis for each opportunity, identify the evidence that would strengthen it, and decide what would invalidate it. This keeps you focused on changing market conditions instead of forcing every price move into a prediction. Learning how to spot a market trend early means continually testing signals against new price action.
TickerAI’s AI Stock Opportunity Discovery, Swing Trade Setups, and Smart Watchlist & Alerts can help you organize opportunities for further review. Use them to support your research and keep emerging setups visible as conditions change. Signals can fail, so weigh each idea against your analysis and risk tolerance.
Contact TickerAI to discuss your needs and explore how its tools could fit your market research. Keep refining your process, stay attentive to new evidence, and approach each developing trend with discipline.
Frequently Asked Questions
Should you trade reversals before confirmation?
Trading before confirmation is an anticipatory decision, not a confirmed trend-following signal. When considering how to spot a market trend early, distinguish the signal you’re monitoring from the evidence that would validate a reversal. Define what would invalidate your thesis before acting. For example, if a stock makes a lower low after a suspected bullish turn, the reversal case weakens and needs reassessment.
What timeframe works best for spotting trend reversals?
The best timeframe depends on your intended holding period and which price swings matter to your strategy. Fidelity describes intermediate trends as lasting 1 to 3 months and minor trends as lasting less than 1 month. Align your chart timeframe with your decision horizon. An intraday fluctuation may carry little weight for someone assessing a longer-term investment.
What are the earliest indicators of a new market trend?
Early clues can include improving relative strength against a broad index, a shift in sector leadership, or price holding above prior resistance. To explore how to spot a market trend early, compare related stocks instead of relying on one ticker’s sudden move. Company news may explain increased attention, while peer performance can show whether interest is spreading across the theme.
How can you distinguish a lasting market trend from short-term noise?
Look for persistence across multiple closes and supporting participation, not an isolated price spike. Compare the move with the stock’s recent range, volume pattern, and performance against its sector. A sharp advance that quickly reverses is weaker evidence than one that holds its gains in later sessions. Track whether the original catalyst continues to shape market expectations.
What quantitative metrics can measure trend growth and market demand?
For price trends, track percentage change over your chosen review period, moving-average slope, relative strength against an index, and volume compared with the stock’s own average. For business demand, examine reported revenue growth, unit sales, order activity, or customer retention when available. Search-interest direction can add an attention signal. Compare metrics over consistent periods to avoid mixing timeframes.


