

A swing trade has no fixed deadline to work: the holding period can range from at least one day to several weeks, with most trades lasting 2-10 trading days. The criteria for a good swing trade setup include a clear trigger, enough volume to support the move, and a defined exit if the trade fails. For a multi-week consolidation breakout, look for at least 15 trading days in a range no wider than 8-10%, followed by a close above the range on volume at least 50% higher than the 20-day average.
A breakout can look compelling yet offer too little room to reach a sensible target, or expose you to more earnings risk than your position size allows. Use these criteria for a good swing trade setup to assess the breakout range and volume, size an earnings-gap trade more conservatively, and map Fibonacci retracement entries and exits. Then connect the trigger to a protective stop and realistic profit target to judge the trade before committing capital.
Key Takeaways
- Scale earnings-gap positions down and calculate share size from the distance to the structural stop.
- Use a clear swing high and low from the prior 4-8 weeks to map potential Fibonacci retracement entries.
- Align trade direction with the larger trend, then assess whether nearby resistance leaves enough room for a worthwhile target.
- Define the exit and acceptable risk before entry so a promising setup has a clear invalidation point.
Consolidation breakout volume and range thresholds
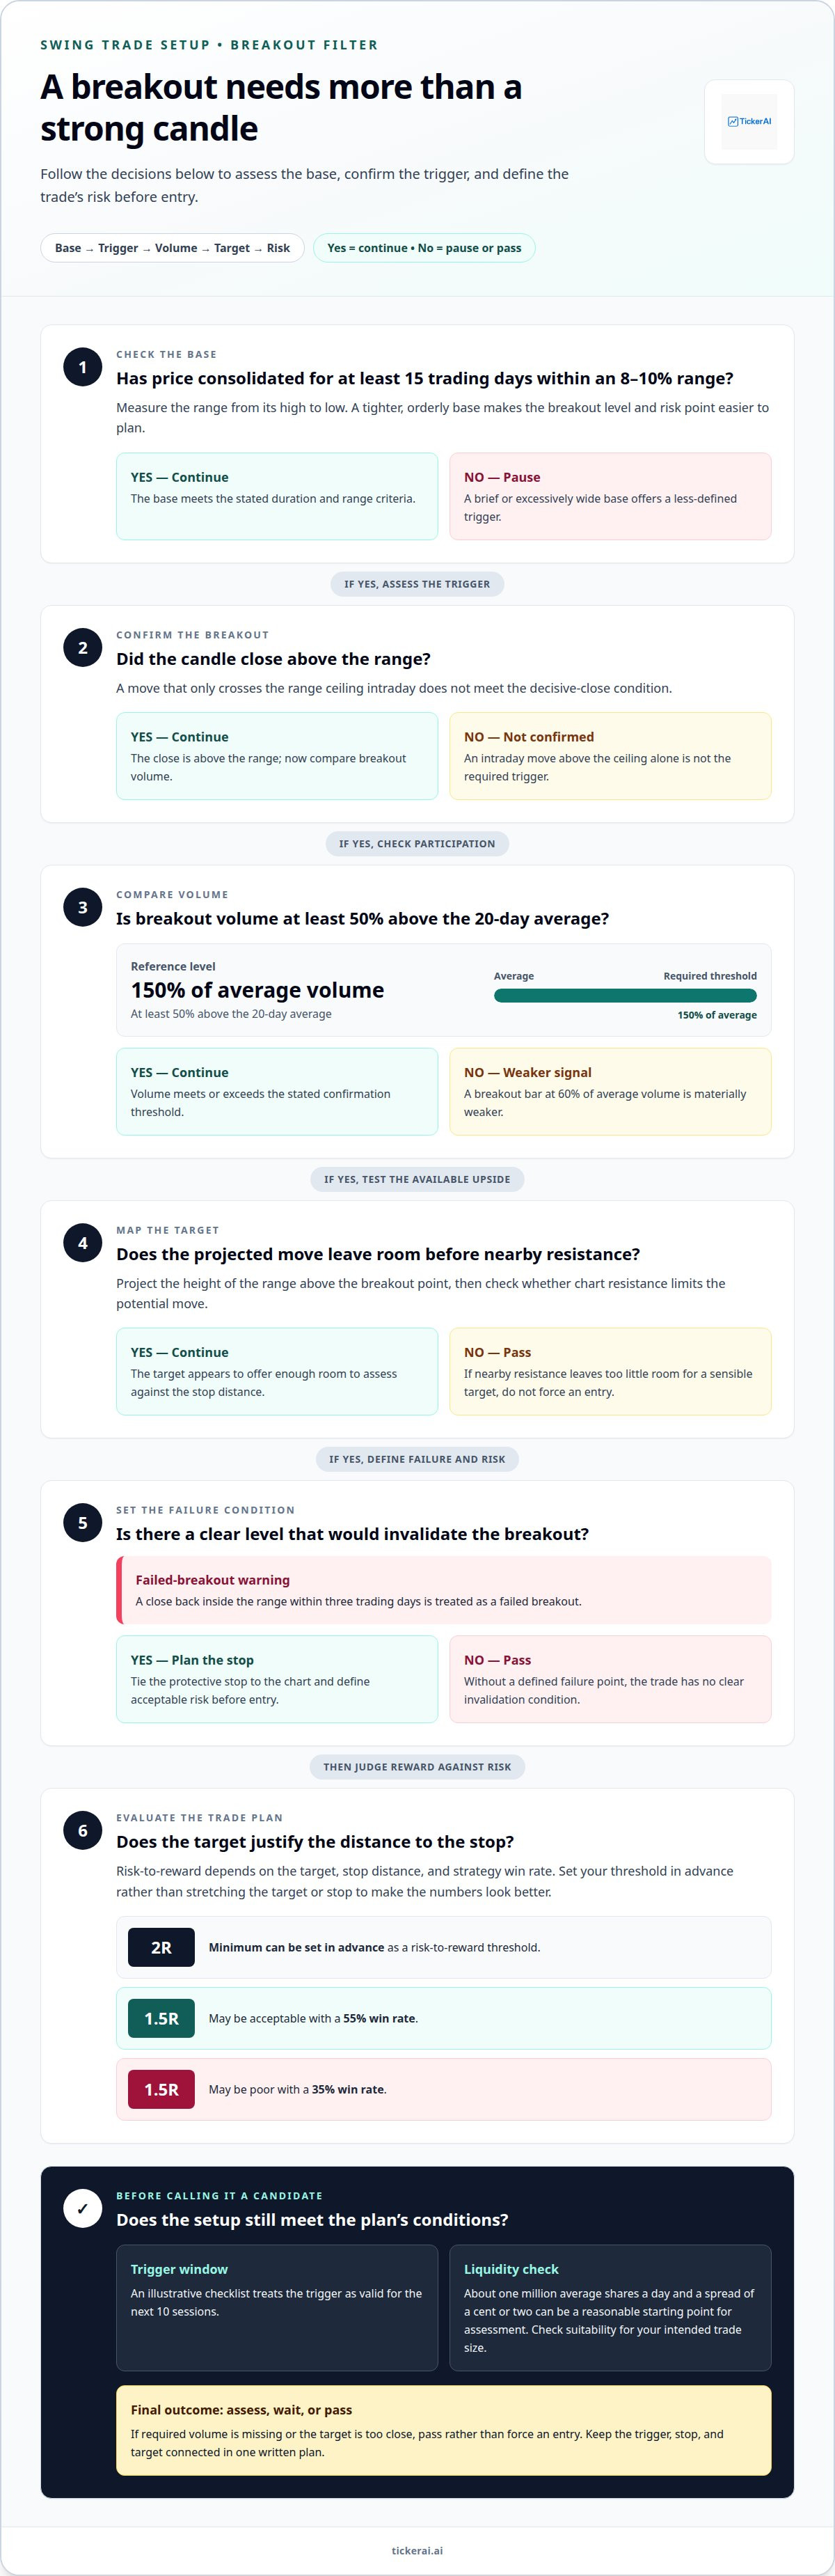
The criteria for a good swing trade setup start with a defined base, not a single strong candle. Look for at least 15 trading days of consolidation after a prior advance. Keep the range from its high to low within 8-10%. A tighter, orderly base makes the breakout level easier to identify and the risk point easier to plan.
Screen actively traded stocks and ETFs moving within broad, well-defined channels. Build a candidate list, then monitor it daily for a base approaching resistance. Liquidity matters: about one million average shares a day and a spread of a cent or two can provide a reasonable starting point for assessment. Check that these conditions suit your intended trade size.
- Check the base. Confirm at least 15 trading days and an 8-10% maximum range; a brief or excessively wide base offers a less defined trigger.
- Require a decisive close. The breakout candle should close above the range, not merely cross its ceiling intraday.
- Compare volume. Look for volume at least 50% above the 20-day average; a breakout bar at 60% of average volume is materially weaker.
- Define the target. Project the range height above the breakout point, then assess whether nearby chart resistance limits the potential move.
- Set the failure condition. Treat a close back inside the range within three trading days as a failed breakout.
A favorable risk-to-reward ratio depends on the target, stop distance, and the strategy’s win rate. A 2R minimum can be set in advance; a 1.5R trade may be acceptable with a 55% win rate, but poor with a 35% win rate.
Keep the trigger time-limited: an illustrative checklist treats it as valid for the next 10 sessions. If price breaks out without the required volume, or the planned target sits too close, pass rather than force an entry.
Earnings-gap setup and position sizing
An earnings-gap setup starts with a stock opening at least 5% higher after reporting earnings. The gap signals a sharp repricing, but it doesn’t define a safe entry by itself. Identify the structure supporting the move, then set an entry and protective stop before sizing the position. If the stop sits far below the entry, reduce shares rather than widening acceptable account risk.
Size against both the stop distance and your account risk limit. A common framework in this setup uses 50-75% of normal position size and risks 1-2% of account capital per swing trade. These are separate controls: smaller position size limits exposure to the gap’s volatility, while the stop distance determines how much each share puts at risk.
- Mark the invalidation level. Use a structural stop tied to the chart, not an arbitrary price.
- Calculate per-share risk. Subtract the stop from the planned entry before choosing share quantity.
- Check the event calendar. Earnings six trading days away fall inside the intended holding period in this example, so the event is a veto.
Warning signs include no clear structural stop, a position exceeding your planned risk limit, or an earnings announcement during your intended holding period. Be cautious with a gap when the chart offers no logical invalidation point. Without one, you cannot tie position size clearly to risk.
For example, an entry at $84.40 and a structural stop at $80.10 create $4.30 of risk per share. Divide the maximum permitted trade loss by that per-share risk to determine share quantity. If the resulting position conflicts with the reduced earnings-gap size, skip the trade instead of forcing the calculation.
Write down the entry, stop, share count, and reason for the trade. Those records let you review execution across setups rather than judging one outcome in isolation. A structured swing-trade setup scan can help surface candidates for this evaluation.
Fibonacci retracement entries and exits
Start with a clear swing high and swing low from the prior 4-8 weeks. These anchors define the impulse move you’re measuring. In an uptrend, draw the retracement across that advance, from low to high. The 50% and 61.8% levels then mark potential pullback entry zones, not automatic buy signals.
Use this sequence to turn chart levels into a plan:
- Mark the anchors. Select the meaningful low and high from the prior 4-8 weeks, rather than a minor intraday fluctuation.
- Plot the retracements. Identify the 50% and 61.8% levels across the advance.
- Watch the reaction. Look for price to stabilize or turn near a level before considering an entry.
- Set invalidation. Choose the price action that would show the pullback has weakened the original trend.
For example, if a stock rallies from a clear swing low to a later swing high, a pullback toward 50% or 61.8% can provide a potential entry area. The level alone doesn’t confirm support. A failure to hold, followed by continued selling, weakens the setup; a reversal near the level gives a clearer trigger to assess.
Plan the exit before entering. In an uptrend, consider the prior swing high as a potential target, then assess any resistance between it and the current price. If the target offers too little room compared with the distance to your invalidation point, the setup may not justify the risk. Set the stop at a chart level that would disprove your trade thesis, not at an arbitrary point chosen to create an attractive risk-to-reward ratio.
Fibonacci levels work best as a map of possible support and resistance. Treat 50% and 61.8% as areas to observe, then combine price reaction, trend structure, and a defined exit. That process keeps the entry tied to the prior 4-8-week move while making the risk decision explicit.
How to Use Trend, Support, and Resistance in Swing Trading
For a swing trade held for eight sessions, use daily and weekly charts to assess direction. A weekly uptrend can support a long bias, while daily price action helps refine timing. For example, a stock or ETF may have an upward weekly trend and short, sharp bottoms on its daily chart. Those daily lows can show where buyers have stepped in before.
Map nearby support and resistance before choosing an entry. Support can frame a potential entry area; resistance can define a practical target or warn that upside is limited. A breakout entry with resistance only 2% higher may leave too little room for a target that justifies the trade’s risk. Compare the distance to resistance with the distance to your planned stop.
- Align direction with structure. Check whether the weekly trend supports the trade idea before using the daily chart to time it.
- Mark the decision zones. Identify visible support below price and resistance above it, then assess the space between them.
- Wait for confirmation. One approach is to wait for a change of direction, then enter with developing momentum rather than anticipating the turn.
- Use the channel for exits. Buying near a lower channel band and taking profits near the upper line gives the trade defined reference points.
Adapt exits to market conditions. In a weak market, consider taking the first available profit rather than assuming price will reach the channel top. If a strong swing moves beyond the channel line, consider waiting for price to stop making new highs before exiting. Beginners can keep to the plan and take profits when price reaches the channel line.
Keep a protective stop reasonably close to entry, with its placement tied to the support or chart level that invalidates the idea. Before entering, confirm the weekly direction, daily structure, available room to resistance, and exit condition. Use swing trade setups to identify candidates for this trend-and-level review.
TickerAI: Swing Trade Setups
TickerAI helps traders discover potential opportunities through curated Swing Trade Setups and AI Stock Opportunity Discovery. Use these tools as a focused starting point, then assess each candidate against your own entry, stop, and exit rules. Smart Watchlist & Alerts can help you monitor stocks you are considering, while Long-Term Investment Ideas address a different investing horizon.
Your judgment still matters. Review the chart structure, earnings timing, position size, and risk before deciding whether a setup fits your plan. TickerAI surfaces ideas, but does not replace your trade decisions or risk controls.
Contact TickerAI to learn more about its swing trade setups.
Make Your Next Setup Measurable
Treat each trade as a testable decision, not a verdict on your skill. Record the setup type, entry logic, stop, planned target, and outcome. Review similar trades together. Your journal can reveal whether losses cluster around weak triggers, late entries, or exits that stray from the plan. Use that feedback to make your process more repeatable.
Use the criteria for a good swing trade setup as a filter, then examine your own results to decide whether a pattern deserves continued use. Evaluate each setup after 30-40 trades; a profit factor above 1.5 is a solid review benchmark. Track how your decisions hold up across different market conditions, and adjust your rules when your records show a consistent weakness.
TickerAI brings together AI Stock Opportunity Discovery, Swing Trade Setups, and Smart Watchlist & Alerts to help surface and monitor trade ideas. Ask TickerAI about your swing setup, then keep refining your process with discipline and clear records.
Frequently Asked Questions
How long should a swing trade setup take to work?
Most swing trades last 2-10 trading days, though a move can develop over several weeks. Judge progress against the setup’s trigger and planned holding period, not an arbitrary deadline. If price stalls, loses momentum, or invalidates the chart thesis, reassess rather than extending the trade automatically. A setup’s timeframe should match the price structure it relies on.
How many of these criteria does a setup have to pass before you take it?
There is no universal pass count: a setup must meet every rule you have marked as essential. Treat a missing trigger, unclear invalidation point, or unacceptable risk as a reason to stand aside, even when other signals align. A written checklist separates non-negotiable filters from supporting evidence, helping you avoid overlooking a failed core condition because the chart looks strong.
Is a chart pattern useless on its own?
No. A pattern alone does not make a complete trade plan. A flag, base, or reversal needs context: the prevailing trend, nearby price levels, market participation, and a clear point where the idea fails. For example, a bullish pattern just below resistance may leave limited upside. Use the pattern to frame a hypothesis, then check whether the surrounding chart supports it.
What Is Swing Trading?
Swing trading aims to capture price moves lasting at least a day and potentially several weeks. Traders use chart structure and planned entry and exit levels to participate in a move without necessarily holding for the long term. Trades can be long or short, but each still needs defined risk and an exit plan.
What makes a swing trade setup high probability?
No setup guarantees a win. A stronger candidate has evidence pointing in the same direction: the broader trend supports the trade, the trigger is identifiable, and the planned target leaves room relative to the stop. Consider whether the setup has also performed consistently in your own records. Distinguish repeatable conditions from one-off results before committing capital.
Which technical indicators help identify swing trade entries?
Moving averages, RSI, and volume can help assess trend, pullback strength, and participation. For one 20 EMA mean-reversion framework, price stays above the 200 EMA, pulls within 2% of the 20 EMA, and RSI sits between 40 and 55. Pullback volume below its 20-day average is another filter. Treat indicators as context, not standalone entry commands.


