

A trading signal is only the start; the edge depends on how consistently you turn it into a tested rule, an executable order, and a monitored position. Developing a systematic trading approach means defining those rules in advance, then evaluating how they perform across different market conditions. The aim isn’t to predict every move. It’s to make decisions repeatable and measurable.
That distinction matters. A strategy can look compelling in historical data yet fail when market conditions shift, costs erode returns, or execution falls behind the signal. A disciplined process makes these weaknesses visible before they affect live decisions.
This guide explains systematic trading, compares trend-following, mean-reversion, and momentum strategies, and shows how quantitative analysis can help identify market inefficiencies. It also covers backtesting, risk controls, trading costs, execution, and monitoring, tracing the process from signal to trade.
Key Takeaways
- Use historical backtests to assess a strategy, then forward testing to see how its rules behave beyond the data used to design it.
- Account for spreads, commissions, execution timing, and position monitoring when evaluating whether a signal can translate into a workable trade.
- Match trend-following, mean-reversion, or momentum rules to the market behavior they’re designed to capture.
- Use quantitative analysis to investigate potential market inefficiencies, while treating them as hypotheses to test rather than guaranteed edges.
What is systematic trading?
Systematic trading applies predefined rules to market data to generate trading decisions. Backtesting and forward testing evaluate how those rules perform.
Strategy Hypothesis Validation
A strategy hypothesis identifies a market behavior, its signal, and entry and exit rules. Measurable rules let backtests test the premise rather than hindsight. For example, test whether an AAPL 20-day Simple Moving Average crossing above a 100-day Exponential Moving Average generates positive returns after costs. In the U.S., systematic trading must follow applicable securities rules and account for tax implications. Trading may involve capital gains; tax-loss harvesting can offset gains with losses.
Trading Data Sources and Tools
Systematic trading uses structured market data and computational tools to turn rules into repeatable signals. Inputs may include historical prices, technical indicators, trading ratios, and fundamental measures such as revenue growth and profitability. Quantitative traders can use regression analysis to investigate relationships among prices, technical data, and ratios. Match each observation to when it became available, then use consistent inputs in testing and live analysis.
Backtesting and Bias Prevention
Backtesting applies fixed rules to historical data to estimate how a strategy might have performed. Use only information available at each simulated decision to avoid look-ahead bias. Include securities that later disappeared, rather than testing only current survivors, to reduce survivorship bias. Keep design data separate from later observations, then forward-test unchanged rules on new market data. Record entries, exits, assumptions, and outcomes so performance can be evaluated consistently.
Stress Testing and Performance Evaluation
Stress testing checks whether results persist across different market conditions, not just the period that inspired the rules. Vary test windows and assumptions, then compare returns, drawdowns, and trade consistency. Check nearby parameter values: if a 50-day moving-average rule works only at exactly 50 days, curve-fitting may drive the result. Evaluate costs and risk alongside returns. Historical performance doesn't establish future success.
Trade execution, broker costs, and position monitoring
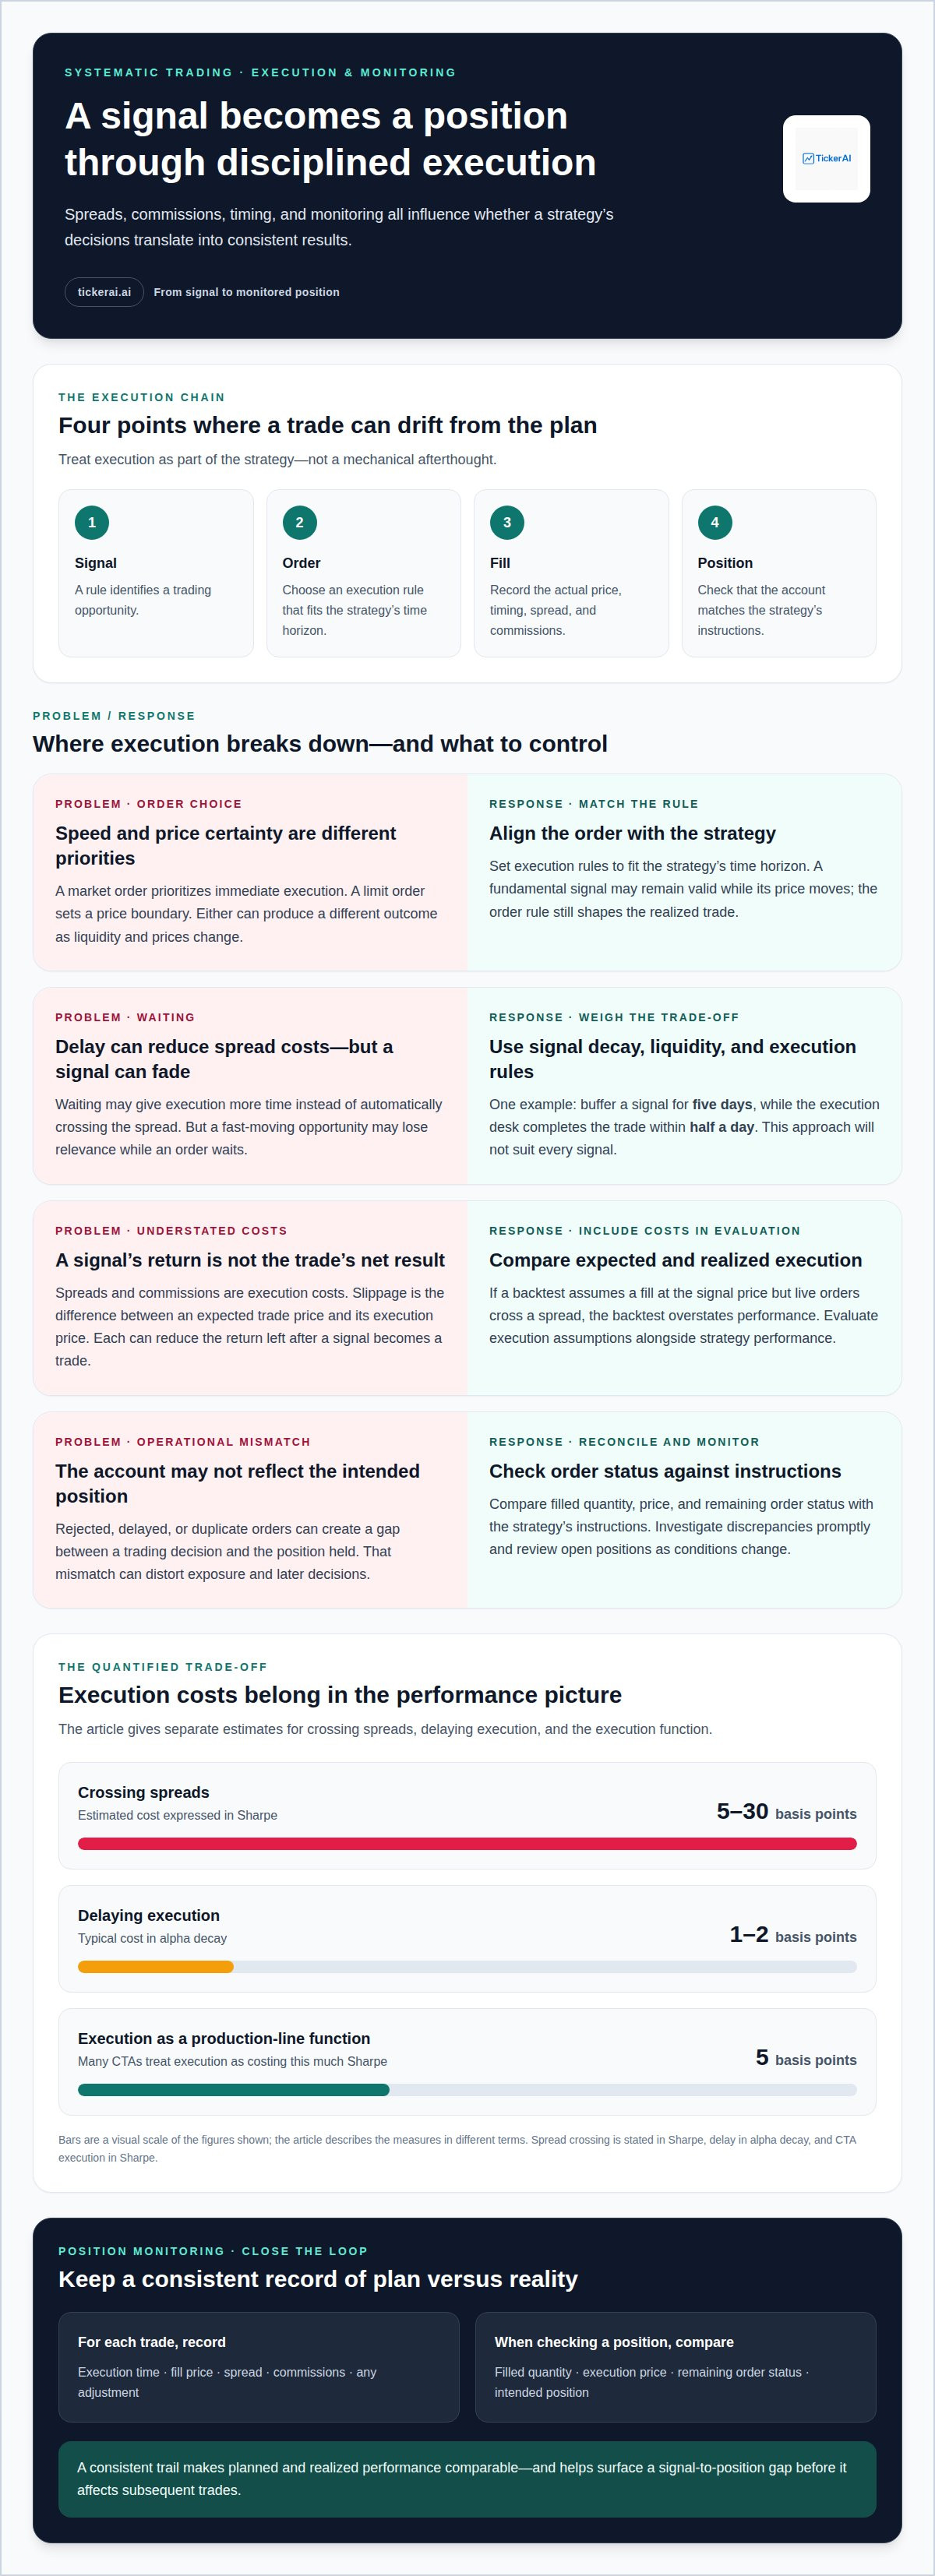
A signal becomes a position only through execution. Spreads, commissions, timing, and monitoring all affect whether a strategy’s decisions translate into consistent results.
Execution is a distinct part of trading, not a mechanical afterthought. A market order prioritizes immediate execution, while a limit order sets a price boundary. Either may produce a different outcome as liquidity and prices change. A fundamental signal may remain valid while its price moves, so match the execution rule to the strategy’s time horizon. Operational controls matter too: reconcile order status with the intended position and investigate discrepancies promptly.
Patience can matter as much as speed. A signal can be buffered for five days, with the execution desk completing the trade within half a day. This gives execution more time instead of automatically crossing the spread. It won’t suit every signal: a fast-moving opportunity may lose relevance while an order waits. The decision depends on signal decay, liquidity, and the strategy’s execution rules.
Execution Costs and Slippage
Execution costs include spreads and commissions; slippage is the difference between an expected trade price and its execution price. Both reduce the return left after a signal generates a trade. Crossing spreads can cost 5-30 basis points of Sharpe, while delaying execution typically costs 1-2 basis points in alpha decay. These estimates show the trade-off: waiting may reduce spread costs, but delay can weaken the signal.
Track expected and realized execution for each trade. If simulated results assume a fill at the signal price but actual orders cross a spread, the backtest overstates performance. Many CTAs treat execution as a production-line function costing five basis points of Sharpe. Execution assumptions therefore belong in performance evaluation, not just operational planning.
Operational Risks and Position Monitoring
Operational risk includes failures between a trading decision and the intended position, such as rejected, delayed, or duplicate orders. After execution, compare filled quantity, price, and remaining order status with the strategy’s instructions. A mismatch between the signal and account position can distort exposure and later decisions. Position monitoring helps detect the gap before it affects subsequent trades.
Review open positions as conditions change, then adjust them when the strategy’s rules call for it. Record execution time, fill price, spread, commissions, and any adjustment. This creates a consistent trail for comparing planned and realized performance. For readers evaluating signals before making separate execution decisions, Swing Trade Setups can provide ideas to assess within their own trading process.
Trend-following, mean-reversion and momentum strategies
These strategies interpret price behavior differently: trend-following seeks sustained direction, mean-reversion anticipates a return toward typical levels, and momentum tracks continued strength or weakness. Their signals may use technical indicators, but each needs rules suited to its market and portfolio role.
Trend-Following Principles
Trend-following enters or holds positions when defined indicators show persistent upward or downward movement. A moving-average crossover, for example, generates a signal when a shorter average crosses above or below a longer one. End-of-day data can support exponential moving-average horizons from 50-to-200 days. Clear entry and exit conditions help traders remain consistent instead of reacting to each price fluctuation.
Trend systems may experience frequent small losses while waiting for extended moves. Seykota-style trend-following strategies can have a 30% to 40% win rate, so evaluating only winning trades gives an incomplete picture. Measure portfolio returns, losing periods, and position exposure together. Institutional approaches also require operational expertise to apply the same rules across instruments.
Mean-Reversion and Momentum Strategies
Mean-reversion strategies look for prices that have moved unusually far from a defined reference, then signal a trade toward that reference. A system might compare price with a moving average and require a separate exit condition. Momentum strategies, by contrast, seek continued movement and use technical indicators to identify strength or weakness. The distinction matters: a signal designed for a persistent trend may struggle in sideways markets.
Compare each strategy with the market behavior it targets. A mean-reversion rule needs a clear reference level; a momentum rule needs defined confirmation and exit conditions. Evaluate both across changing economic conditions and consider their effect on portfolio exposure. Neither signal alone establishes that an investment opportunity suits a trader’s objectives.
For cryptocurrency markets, define the trading venue, data interval, and signal timing before interpreting trends. Continuous trading can make calendar boundaries and missing observations relevant to a test. Apply the same technical rules to historical and forward observations, then assess whether signals remain consistent. Don’t assume a trend seen on one venue or interval will transfer unchanged to another.
Quantitative trading and market inefficiencies
Quantitative trading turns market observations into measurable relationships, then tests whether those relationships can inform decisions. A market inefficiency is a recurring pricing pattern that a rule may capture before conditions change. The aim is not simply to find correlation, but to determine whether the relationship has a plausible mechanism, withstands analysis, and remains useful after execution costs are considered.
Regression analysis can examine relationships among trading ratios, technical data, and prices. For example, a model might test whether a price relationship changes alongside a technical measure. Define the hypothesis first, select inputs available at decision time, and check whether the relationship persists across market conditions. The goal is to identify a repeatable signal, not explain every historical move.
Market dynamics shift. A pattern linked to one environment may weaken as volatility, liquidity, or participation changes. Separate observations by relevant conditions and compare signal behavior across those groups. If an apparent edge appears only in a narrow sample, extensive parameter tuning may have captured noise rather than an inefficiency. Favor a simple, interpretable relationship that remains coherent across varied data.
Ed Seykota developed sophisticated algorithms to analyze market data and execute trades in the late 1970s and early 1980s. That history illustrates the role of computation: apply a defined process consistently across observations that are difficult to assess manually. Modern quantitative analysis still depends on a sound question, reliable inputs, and careful interpretation. An algorithm can measure a relationship; it cannot establish that the relationship has a durable economic cause.
Before acting on a proposed inefficiency, test whether its signal persists beyond the sample that inspired it, whether alternative inputs change the result, and whether execution could erase its value. Treat a model’s output as evidence to assess, not as an automatic trading instruction. Explore stock opportunities to identify candidates for your own quantitative analysis.
TickerAI
TickerAI helps focus market research on potential opportunities through AI Stock Opportunity Discovery, Swing Trade Setups, Smart Watchlist & Alerts, and Long-Term Investment Ideas. These tools can support research and monitoring within a systematic process, while your strategy rules guide evaluation and execution.
Use these insights to scan for potential signals or organize opportunities for further analysis. Treat each idea as an input to your process, not a substitute for testing, risk controls, or independent trading decisions. Explore TickerAI’s offerings to support your market research.
Put Your Process to Work
Treat your trading rules as a living operating framework. Review whether each decision still follows the original objective, and record where real market behavior diverges from the model. This discipline helps distinguish a genuine shift in market dynamics from an isolated result. It also provides a clearer basis for refining the process without reacting to every short-term fluctuation.
Developing a systematic trading approach is an ongoing cycle of observation, evaluation, and measured adjustment. Keep the logic explicit, record changes, and assess each adjustment against the same standards. To identify opportunities for evaluation within that process, use TickerAI’s market research tools for discovery and monitoring.
Contact TickerAI to explore how its tools fit your trading process. Keep building with clear rules, deliberate review, and confidence in the decisions your evidence supports.
Frequently Asked Questions
What Is a Trading Strategy?
A trading strategy defines what to trade, when to enter or exit, and how to manage risk. It connects a market premise to specific actions. For example, an investor might buy only when a chosen signal appears and exit when a separate condition occurs. Clear rules make decisions repeatable and let you review results against the strategy’s objectives.
What are the key steps for developing a systematic trading strategy?
Start by defining the objective, eligible instruments, and conditions that trigger trades. Then specify exits, position limits, and order handling. Developing a systematic trading approach also means documenting assumptions, testing the rules, and deciding how to review performance. For instance, state whether the signal uses closing prices or intraday data, since that choice determines when a decision can be made.
What performance metrics should be used to evaluate a trading strategy?
Use a set of metrics, since no single measure describes a strategy’s behavior. Review net returns alongside drawdown, volatility, win and loss size, and trading frequency. Compare results with an appropriate benchmark and inspect performance across instruments and market conditions. Strong total returns can conceal long periods of losses, so examine the sequence and duration of declines too.
How should transaction costs, slippage, and market impact be modeled?
Model costs at the order level, including the expected spread, commissions, likely fill price, and how order size affects available liquidity. Small and large orders may receive different fills, especially in less liquid instruments. Test less favorable execution assumptions as well. This shows whether an apparent edge depends on ideal fills that may not occur in live trading.
How do you size positions and manage risk in systematic trading?
Set position size according to the permitted risk and the distance between entry and the planned exit if the trade moves against you. A wider stop generally means a smaller position for the same risk budget. Set limits for individual trades and total portfolio exposure, and account for correlated positions. Several holdings in the same sector, for example, can concentrate risk even when each position seems modest.
How can traders prevent overfitting and test strategy robustness?
Reduce overfitting by limiting unnecessary parameters and reserving part of the historical data for testing. Apply the fixed rules to that unseen sample, then forward-test signals as new data arrives. Compare results across instruments and market environments, not just one favorable period. If small input changes radically alter outcomes, the strategy may depend too heavily on sample-specific noise.


