

A shorter holding period does not automatically make a strategy simpler. The difference between investing and swing trading comes down to time horizon and decision rules: investors focus on long-term growth, while swing traders seek price moves that may last from a day to several weeks.
Both approaches involve risk, but they call for different kinds of attention. Investing typically focuses on a company’s longer-term prospects and less frequent decisions. Swing trading relies more on chart patterns, planned entry and exit points, and closer monitoring of price movements. Neither approach removes uncertainty. The better fit depends on how actively you want to manage positions and which signals guide your decisions.
This guide compares the trade-offs in time, risk, chart analysis, and trading rules. You’ll see how each approach handles entries and exits, why overnight price gaps matter to swing traders, and which practical habits can help keep decisions consistent. Use the comparison to assess which framework aligns with your priorities.
Key Takeaways
- Match your approach to the time you can give positions: long-term investing and swing trading require different monitoring rhythms.
- Account for swing trading’s added exposure to overnight price gaps and more frequent transaction costs when weighing its potential benefits.
- Use chart patterns to frame possible entries and exits, while treating them as decision tools rather than guarantees of a move.
- Define entry, exit, and risk limits before acting so each trade follows a consistent method instead of a reaction to short-term price noise.
Benefits and drawbacks of swing trading
Swing trading creates more opportunities to act on price moves, but it also requires closer monitoring and more decisions. Comparing trading activity, risk, time, and return variability makes its benefits and costs clearer.
Trading Costs, Taxes, and Frequency
Trading frequency is how often you open and close positions, and it affects costs and taxable events. Investors may trade less often, while swing traders make more transactions and may incur additional transaction costs. In the United States, selling can realize gains or losses, and tax treatment depends partly on the holding period. Assess results after costs and taxes, not just a trade’s gross return.
Comparative Risks
Investment risk reflects the possibility that a company or portfolio loses value over time; swing trading adds risks related to short-term timing. An overnight position can gap at the market open after news breaks outside trading hours. Repeated trades also mean more opportunities for losses and transaction costs. Under U.S. brokerage rules, overnight swing trades differ from same-day round trips, which may bring pattern-day-trader requirements into play. Shorting a stock requires an approved margin account and carries theoretically unlimited risk because its price can rise indefinitely.
Starting Money and Time
There is no single starting amount that suits every strategy. Capital needs depend on share prices, position size, and how much loss a trader can absorb. Time demands differ too: an investor may review a long-term holding roughly four times a year, while swing trading calls for closer monitoring and timely decisions. Beginners can weigh these demands against their goals and risk tolerance, then choose an approach they can follow consistently.
Expected Returns and Variability
Returns vary with market movement, entry and exit decisions, and trading costs, so examples aren’t forecasts. One comparison shows a swing trader making 20% while a long-term investor compounds at 12%; it illustrates different outcomes, not a reliable target. In the RKLB example, holding rather than trading in and out could have captured a potential sixfold gain. A trader’s method and discipline matter: five consecutive losses can test whether they stick to their rules.
Swing trading time horizon
Swing trades aim to capture price moves lasting at least a day and potentially several weeks. A position may stay open for days, weeks, or even months, depending on how the price develops. The holding period is part of the strategy, not a fixed deadline. Traders plan around the move they seek, then reassess whether the original setup remains valid.
This horizon falls between intraday trading and long-term investing. A swing trader may hold through several market sessions while tracking whether a price pattern continues. An investor usually evaluates a company over a longer period, when short-term price fluctuations may matter less than the investment thesis. The practical distinction is not simply how long someone owns a stock. It is whether decisions respond mainly to a near-term price move or a longer-term view.
Historical holding-period figures offer context, not a rule for either approach. The average share holding period was 5.5 months as of June 2020, while it peaked at 8 years in the late 1950s. Those figures describe broad market behavior across different periods. They do not define the intended duration of an individual swing trade or investment.
Company news can shape a trade’s timeline. For example, a stock may rise after strong quarterly results, then give back some of those gains about a week after the announcement. A swing trader might focus on that temporary move, while a long-term investor could assess whether the results change the company’s longer-term outlook. The same event can inform different decisions.
Before entering a trade, define what would keep the setup active and what would invalidate it. A swing trade planned to last several weeks may no longer fit its original plan if the expected price pattern changes. An investment can remain open through short-term movement while its underlying rationale holds. Matching the review schedule to the intended horizon helps prevent a temporary fluctuation from automatically dictating a long-term decision.
Technical analysis and price-chart trends
Technical analysis uses price and trading activity to assess possible market moves. Swing traders use it to identify patterns, potential entries, and exit levels. Investors may also review charts, but often give greater weight to a company’s longer-term prospects. The chart’s role depends on the decision at hand.
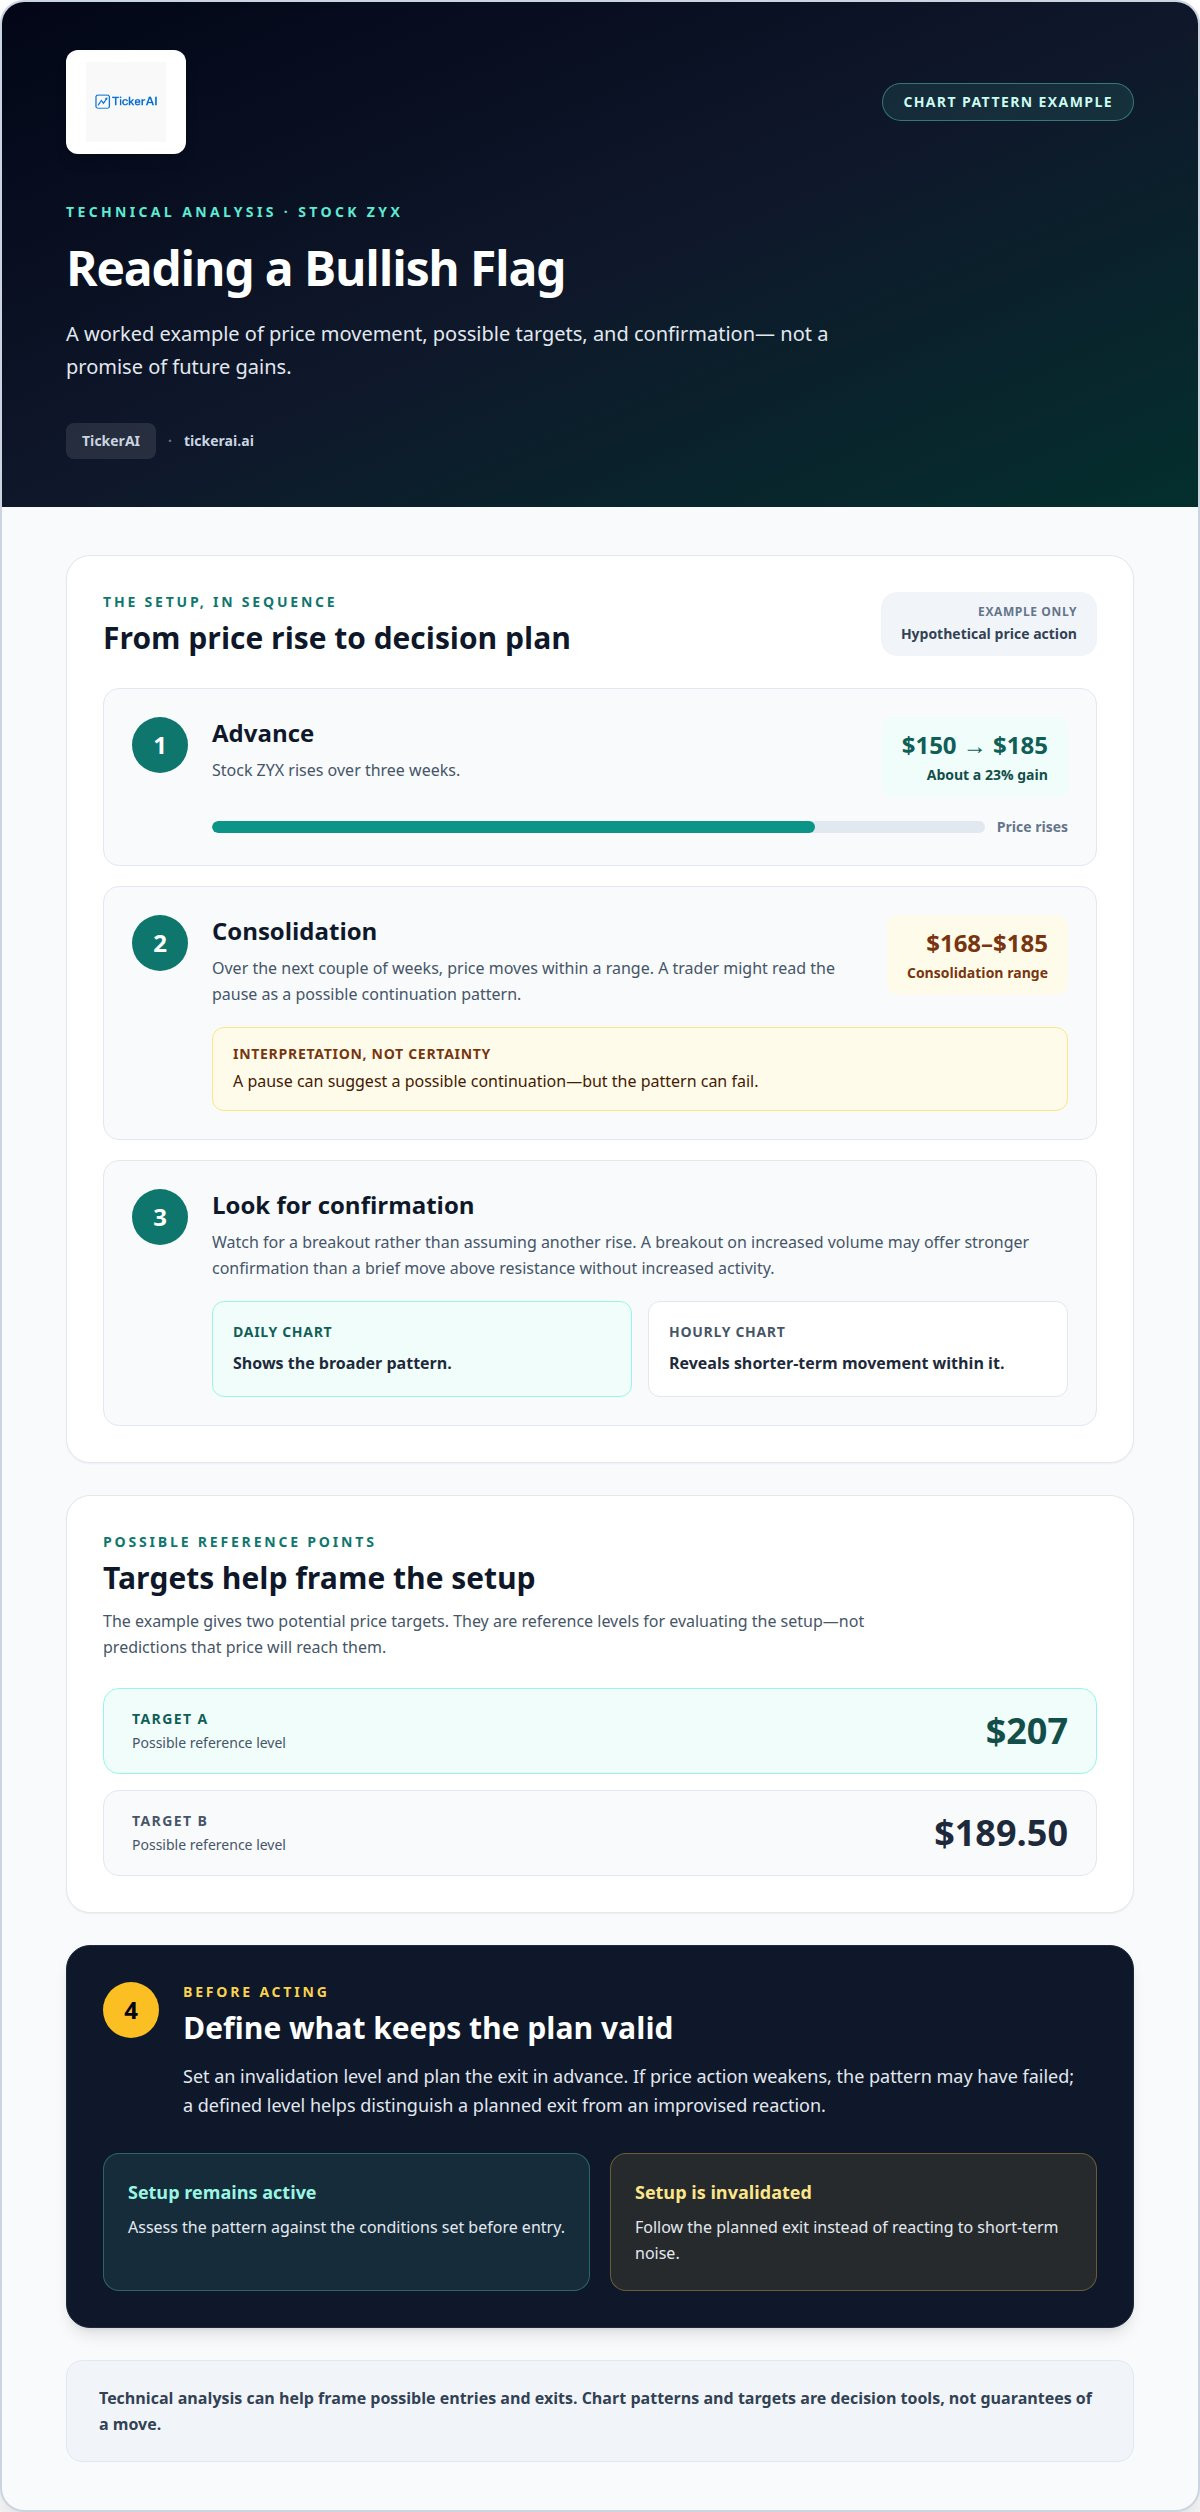
Consider a hypothetical bullish flag in Stock ZYX. The stock rose from $150 to $185 over three weeks, a gain of about 23%. It then consolidated between $185 and $168 over the next couple of weeks. A trader might read the pause as a possible continuation pattern, then watch for a breakout rather than assume another rise.
The example gives two possible price targets. Target B is $189.50, while target A is $207. Those levels create reference points for evaluating a setup, not predictions that the stock will reach either one. If price action weakens instead, the pattern may fail. A defined invalidation level helps distinguish a planned exit from an improvised reaction.
The chart timeframe also affects what a trader sees. A daily chart can show the broader pattern, while an hourly chart can reveal shorter-term movement within it. Comparing the two helps separate the setup from the timing decision. For instance, a breakout on increased volume may offer stronger confirmation than a brief move above resistance without increased activity.
Technical analysis can also test a repeatable method. One example tracks an instrument returning to its moving average three times and penetrating it by an average of 1.5% of its price. A hypothetical buy order sits about 1% below that average. The figures illustrate a rule-based approach, not a universal template.
For context, a trading channel has an upper and lower boundary. Capturing the full move between them would represent 100% of the channel; capturing half represents 50%. Traders may look to take profits near the upper line, while selecting actively traded stocks or ETFs with clearly defined channels. The pattern guides decisions, but risk limits still shape the trade.
Entry and exit rules
A swing-trading plan defines the price conditions for entering, taking profits, and limiting losses. These rules turn a chart signal into a decision framework before market movement creates pressure. For example, a trader may wait for a breakout on increased volume, then set an exit level based on the point that invalidates the setup. An investor may instead base a purchase on a longer-term view of the company.
In the hypothetical bullish-flag example, entry occurs at $172 when price breaks out of the channel on increased volume. The stop level is $167.50, creating estimated risk of $4.50 per share. This separates the entry trigger from the point where the trade thesis no longer holds. A protective stop placed reasonably close to entry can help define exposure, but a stop order isn’t guaranteed to execute at or near its activation price.
Time rules matter too. One example sets a 4% return goal before one week has passed. If the shares gain 3% after one week, the trader exits rather than waiting indefinitely for the original target. That rule makes the holding period part of the plan. It also reduces the temptation to change the target simply because the trade is open.
Charts can inform different decisions at different scales. A daily chart may establish the setup, while an hourly chart helps plan entry and exit points. The daily view frames the broader move; the hourly view adds timing detail. Neither replaces a predefined risk limit.
Before entering, traders can record the trigger, target, stop, and conditions for closing early. They can also decide how much loss they will accept. One example uses a 5% maximum acceptable loss during the week and a stop-loss order to sell at that point. A consistent method and clear records make it easier to review decisions after each trade. Review entry and exit signals alongside a structured plan.
TickerAI: Swing Trade Setups
TickerAI provides Swing Trade Setups for readers who want structured market ideas to assess alongside their own entry, exit, and risk rules. Use them as a starting point for evaluating potential trades, not as a substitute for a personal trading plan. AI Stock Opportunity Discovery and Smart Watchlist & Alerts can help surface opportunities and track selected stocks. For a longer-term approach, TickerAI also offers Long-Term Investment Ideas.
Use these tools when scanning market activity takes time or you want a more organized flow of ideas. Compare each setup with your chosen time horizon and risk limits before making a decision. The platform supports research and discovery; the trade decision remains yours.
Contact TickerAI to learn more about Swing Trade Setups.
Choose a process you can sustain
The difference between investing and swing trading matters most when you turn a preference into a repeatable process. Decide how actively you want to manage positions, what information will guide your decisions, and how you’ll respond when market conditions shift. Then use those priorities to assess opportunities without letting urgency replace a clear plan.
TickerAI’s AI Stock Opportunity Discovery, Swing Trade Setups, and Smart Watchlist & Alerts can support different parts of your research workflow. Use the signals and ideas as inputs to your own analysis, in line with the approach you’ve chosen. Keep your decision framework consistent, and refine it as you learn which information helps you act with discipline.
Contact TickerAI to discuss your approach, and take the next step with a clearer process and focused market research.
Frequently Asked Questions
What Is Swing Trading and How Does It Work?
Swing trading aims to capture a price move by opening a position and closing it when the planned setup changes or reaches its objective. A trader first identifies a possible pattern, then decides what price action would support or invalidate the idea. For example, a stock nearing resistance may prompt a trader to wait for confirmation before entering, rather than buying simply because its price has risen.
What is the difference between investing and swing trading?
The difference between investing and swing trading lies mainly in the decision horizon and what drives each decision. An investor might buy shares because they expect a company’s business to grow over time. A swing trader might focus on a temporary price pattern in those same shares. One stock can suit either approach, but the reason for holding it and the conditions for selling differ.
How long do investors and swing traders typically hold positions?
Investors often hold positions while their original view of a company remains intact, whereas swing traders hold until their price-based setup reaches its planned outcome or fails. Neither approach has a universal holding deadline. For example, a change in a company’s prospects may affect an investor’s decision, while a reversal in a chart pattern may prompt a swing trader to close sooner.
How do investing and swing trading differ in goals and strategies?
Investors generally seek to build value over a longer horizon, using a thesis about the company or portfolio to guide decisions. Swing traders target shorter-term market movements and set trade conditions around price behavior. For example, an investor may continue holding through a temporary pullback if the business outlook remains sound. A swing trader may close when the price no longer supports the original setup.
What research and technical analysis do investors and swing traders use?
Investors may examine a company’s earnings, business model, competitive position, and longer-term prospects. Swing traders tend to focus more closely on price charts, trading activity, support and resistance, and pattern changes. Research should fit the decision: a short-term chart signal alone does not explain a company’s long-term value, while company analysis may not pinpoint a timely trade entry.


