

Price levels matter most when they define both your trigger and your exit. Swing trades commonly remain open for 2-10 trading days, with entries planned around support, resistance, pullbacks, or breakouts and exits set around a profit target or a level that invalidates the setup. Planning entry and exit points for swing trades means mapping those decisions before placing a trade, not reacting to every price move.
A clear plan turns a chart idea into a defined setup. This guide explains how swing trading works and how to identify potential entries, set risk-reward targets, place stops, and use trailing stops as a trade develops. You’ll also see how support, resistance, trendlines, moving averages, and price patterns can frame decisions, so each trade has a trigger, an exit condition, and a risk limit before you act.
Key Takeaways
- Size each position around the distance between your planned entry and stop, so risk is defined before the trade begins.
- Set a profit target and a trailing-stop rule in advance to manage the trade as price moves.
- Use support, resistance, and other price levels to identify potential triggers and points where a setup no longer holds.
- Combine a clear trade plan with swing trade setups and watchlist alerts to focus on opportunities that match your criteria.
1. What Is Swing Trading?
Swing trading aims to capture a price move over several sessions rather than opening and closing a position within one day. Most swing trades last 2-10 trading days, though the actual holding period depends on the setup and market movement. A trader may enter after a pullback or breakout, then exit at a planned target or when price action invalidates the trade. Unlike day trading, swing trading strategies allow positions to remain open overnight.
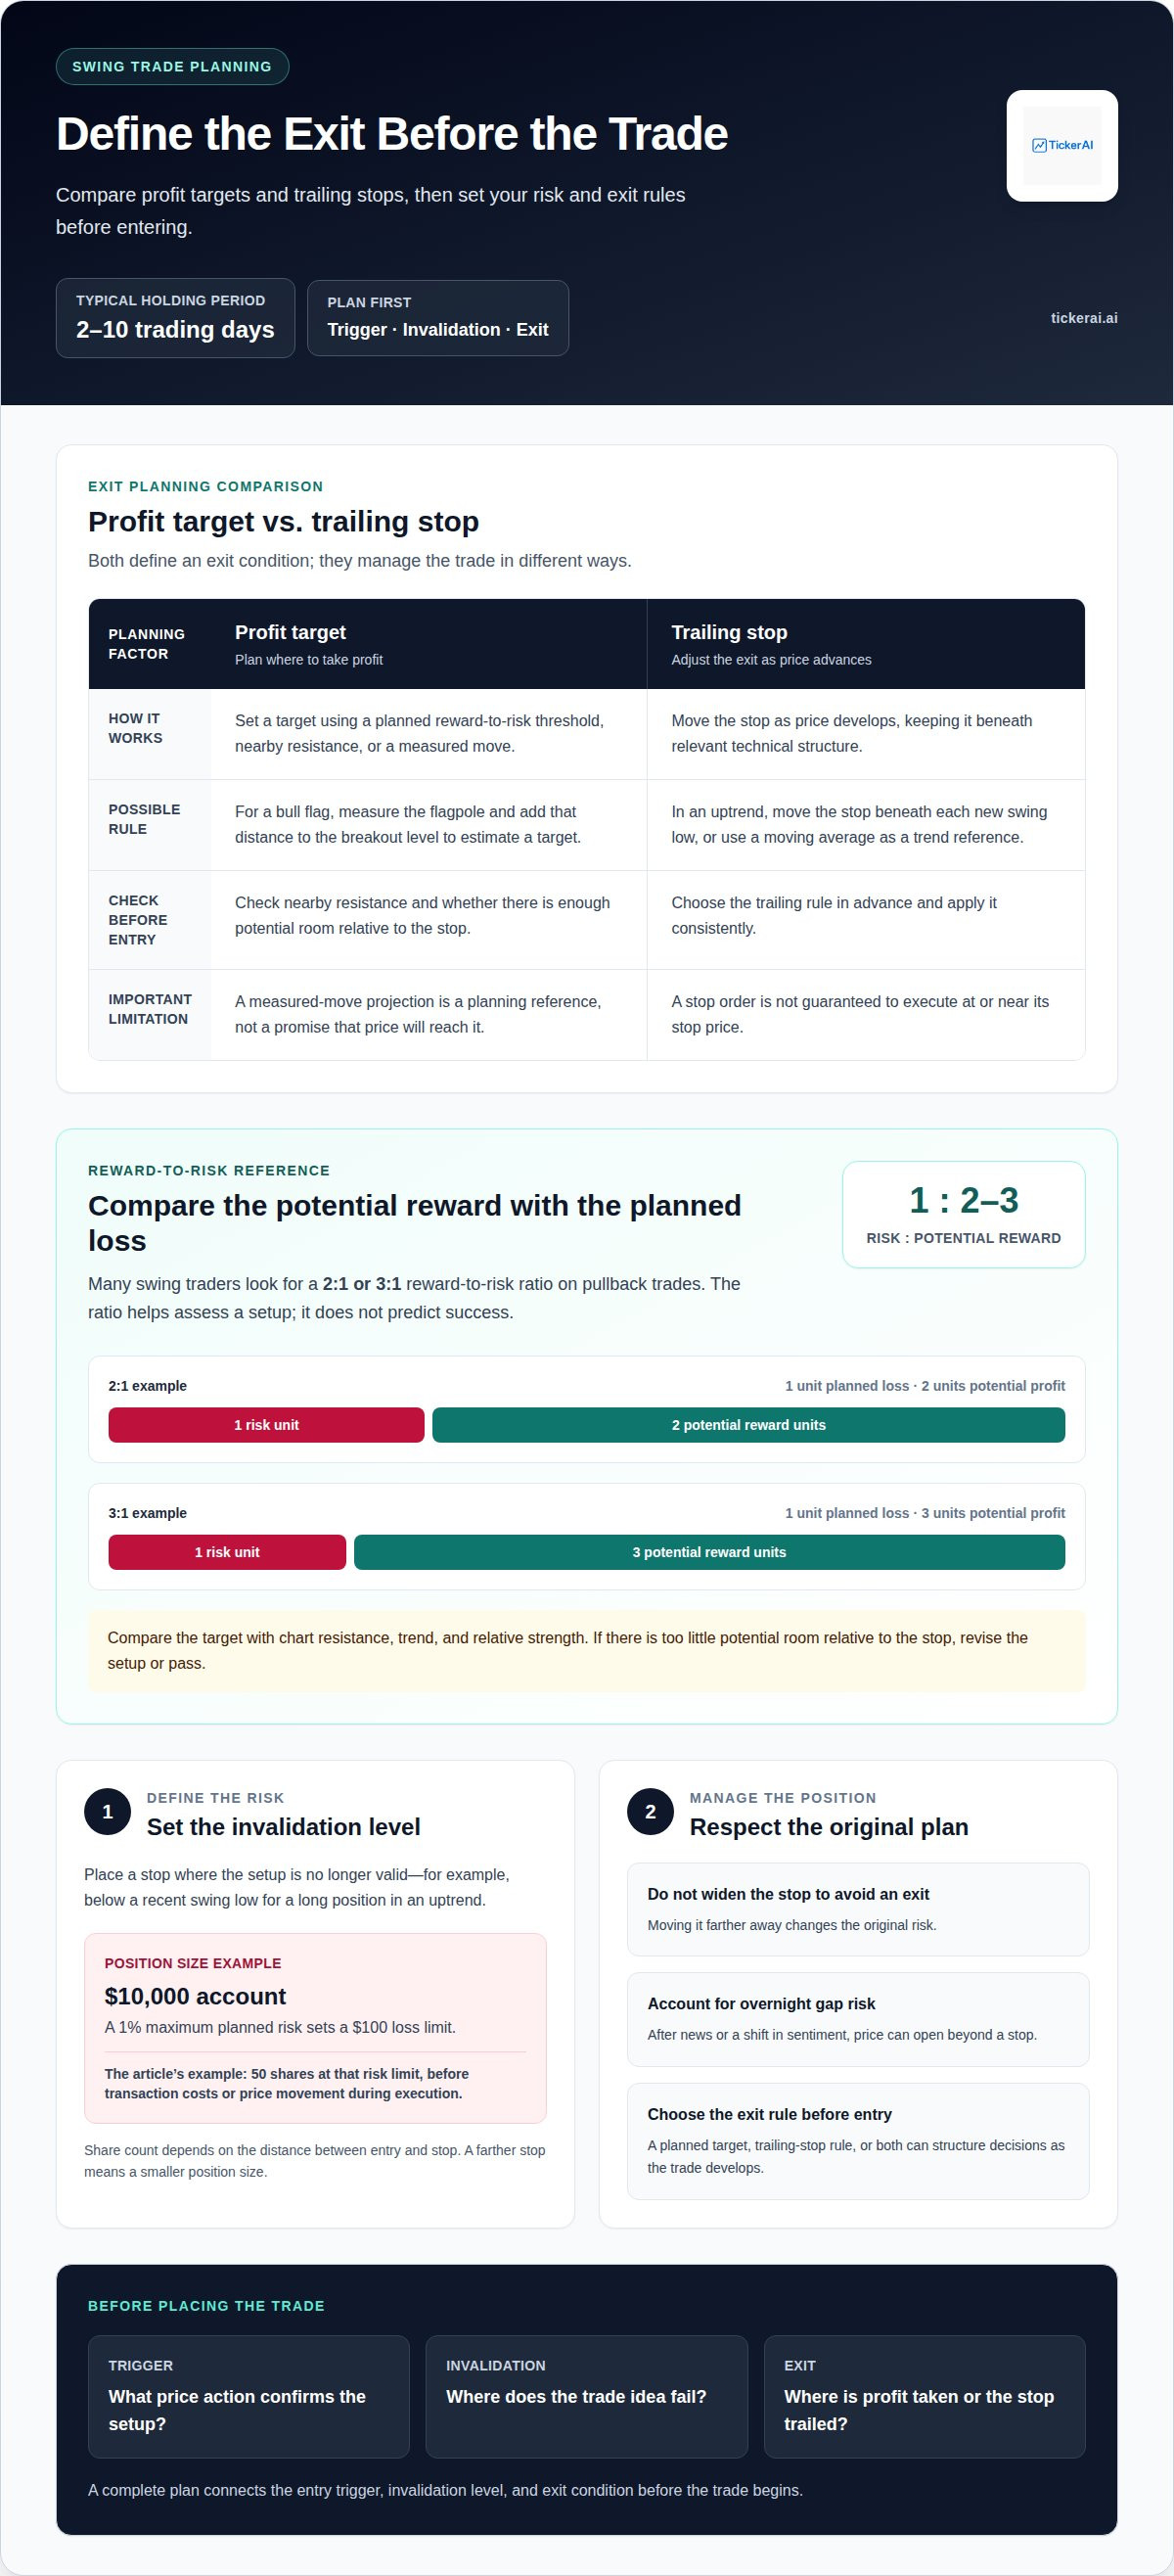
Position sizing starts with the amount of capital at risk, not the number of shares that feels comfortable. A conservative guideline is to risk no more than 1% of account equity on a single trade. For a $10,000 account, that sets a maximum planned loss of $100. The share count depends on the distance between entry and stop: divide the $100 risk limit by the per-share loss at the stop. If the stop is farther from entry, reduce the position size.
Place a stop-loss where the setup is no longer valid, such as below a recent swing low for a long position in an uptrend. Then calculate size using that stop distance. A $100 risk limit therefore corresponds to 50 shares before considering transaction costs or price movement during execution. The stop defines the trade’s risk; position sizing keeps that risk aligned with account capital.
Market conditions and trading volume can help you judge whether an entry or exit signal has support. A breakout above resistance on stronger volume may indicate broader participation, while a low-volume move offers weaker confirmation. As conditions change, reassess the setup’s price levels and exposure rather than widening a stop just to keep a position open. Before entering, compare the trade’s potential with the risk at the planned stop. This links the chart signal to a defined position and exit plan.
2. Risk-reward targets and trailing stops
Set a profit target against the distance from entry to the stop. Many swing traders look for a 2:1 or 3:1 reward-to-risk ratio on pullback trades. If the planned loss is one unit, a 2:1 target seeks two units of potential profit. This ratio helps assess whether a setup’s upside justifies its defined risk. It does not predict success or replace analysis of the chart’s resistance, trend, and relative strength.
Use a measured move when a chart pattern offers a clear projection. For a bull flag, measure the flagpole and add that distance to the breakout level to estimate a target. Treat the projection as a planning reference, not a promise that price will reach it. Check for nearby resistance that could interrupt the move. If there is too little potential room relative to the stop, revise the setup or pass.
A trailing stop can adjust your exit as price advances. One approach is to move it beneath each new swing low in an uptrend, below relevant technical structure. Another is to use a moving average as a trend reference. Choose the rule before entry and apply it consistently. Moving a stop farther away simply to avoid an exit changes the original risk. A stop order is not guaranteed to execute at or near its stop price.
Common profit-taking rules include setting a target at the next resistance level, using a measured move, or scaling out at a planned reward-to-risk threshold. Some traders close the remaining position when a trailing stop is reached. Multi-day positions also carry overnight gap risk: after news or a shift in market sentiment, price can open beyond a stop. Account for this possibility when sizing a position, and don’t treat a stop price as a guaranteed exit price. These strategies structure decisions, but each setup’s results depend on its rules and execution.
3. Support and resistance levels
Support is a price area where buying has previously slowed or reversed a decline. Resistance is an area where selling has interrupted an advance. Mark zones around repeated turning points instead of treating each level as an exact price. For a long setup, a pullback toward support can frame an entry, while resistance overhead can suggest a potential target. If price breaks support, the original long-trade premise may no longer hold.
Use prior highs and lows to mark these areas, then watch how price behaves when it returns. A candle that rejects support and closes higher may show buyers responding; a decisive close below the zone signals weakness. Trendlines can connect successive highs or lows, and moving averages can add context when they overlap a marked level. These are chart tools, not guarantees. Stronger setups pair a clear price reaction with the broader trend.
A breakout occurs when price clears defined support or resistance on strong volume. Before entering, identify the level, the confirmation you need, and the price action that would invalidate the setup. A close above resistance can provide confirmation; a quick move back into the prior range may signal a failed breakout. Candlestick patterns, including engulfing patterns and doji formations, can describe the reaction, but read them alongside the level and trend.
Fibonacci retracements can map possible pullback entries after a clear price swing. The 50% and 61.8% retracement levels are commonly used as potential entry zones. For an entry near 50%, one approach places the stop below 61.8%, where the retracement would challenge the setup. Fibonacci extensions at 127% or 161.8% can provide possible second targets. Treat these values as reference levels, then compare them with nearby support, resistance, and the actual price pattern. If a target sits just beyond strong resistance, the chart may offer limited room for the trade to develop.
4. Swing trade entry and exit planning
A complete plan links the trigger, invalidation level, and exit condition before entry. First, identify the trend and nearby price levels. Next, define the price action that confirms the setup. Then mark where the trade idea fails and where you may take profits. Planning entry and exit points for swing trades this way ties each signal to a decision instead of treating every chart movement as an instruction.
Stocks and ETFs use similar chart-based triggers, but the instrument affects what your plan must account for. An ETF tracks a basket of assets, so assess its own price levels and movement. Options add contract-specific factors, including expiration, liquidity, and how the contract responds to its underlying stock or ETF. For each instrument, define entry and exit rules based on its price behavior.
Potential entry signals include a pullback that forms a swing point low: a low, a lower low, then a higher low across three candles. A long entry can follow on the third candle, with the latest swing low helping define invalidation. In an established uptrend, an RSI pullback into the 40-50 zone can also signal a possible entry. Neither pattern alone confirms a reversal or guarantees follow-through.
Moving averages and trendlines help frame direction and timing. For shorter multi-day swings, traders commonly watch the 9-day and 21-day moving averages; longer setups may use the 50-day and 200-day averages. A bullish crossover occurs when the shorter average crosses above the longer one. An ascending trendline connecting higher lows can help locate a pullback area, while a decisive break can weaken the bullish setup.
For a short setup, a swing point high forms through a high, a higher high, then a lower high. The described approach looks for entry on the third candle. Before acting, specify the trigger, stop location, profit objective, and exit signal. Reviewing entry and exit points for swing trades against relative market conditions makes the plan easier to assess. To organize potential candidates around chart-based criteria, review potential swing setups.
TickerAI: Swing Trade Setups
TickerAI’s Swing Trade Setups help traders scan potential opportunities and evaluate them against a defined plan. Use a setup as a starting point for assessing chart levels, entry triggers, stop placement, and possible exits, then make decisions according to your own criteria and risk limits.
TickerAI’s AI Stock Opportunity Discovery and Smart Watchlist & Alerts can help surface stocks and track potential market movements. If you’re balancing shorter-term trades with broader investing ideas, TickerAI also offers Long-Term Investment Ideas. These tools support opportunity discovery, but they don’t replace a trade plan or remove market risk.
If you’re ready to explore swing trade setups, contact TickerAI.
Make Your Trading Process Repeatable
Turn chart decisions into a process you can review over time. Before each trade, record what triggered the entry, what would invalidate the setup, and how you plan to manage the exit. After the trade, compare actual price action with your plan. This record helps you assess how your entry and exit points for swing trades perform in different market conditions.
Focus your review on decisions you control: whether the setup met your criteria, whether you followed your stop and target rules, and what you would refine next time. A trade journal can help distinguish a sound process from an outcome driven by short-term market movement. Apply those observations to future plans instead of changing your rules in response to a single trade.
For a tool to support your market research and setup discovery, contact TickerAI to discuss your strategy. Build your next plan with clear criteria and a measured approach.
Frequently Asked Questions
What Is Swing Trading?
Swing trading aims to capture price movement across multiple trading sessions rather than closing every trade within one day. Positions may stay open overnight, so account for changes between market closes and opens. Traders use chart patterns, trend context, and defined exit conditions to structure each setup. The holding period depends on how the price move develops and whether the original trade idea remains valid.
How do traders identify support and resistance for swing trade entries?
Mark areas where price has repeatedly paused, reversed, or struggled to move through. For example, if several advances stall near a prior high, that area may act as resistance. A pullback toward a prior turning zone can be an area of interest, not an automatic buy signal. Look for the price response, such as a rejection candle or a close through the level, before deciding whether the setup still fits.
Which technical indicators help time swing trade entries and exits?
Moving averages help frame trend direction, while RSI and the stochastic oscillator can show momentum conditions. RSI readings above 70 may indicate overbought conditions, and readings below 30 may indicate oversold conditions. Stochastic readings can help indicate momentum conditions, but an extreme reading alone does not establish that a reversal has started. These signals need chart context: an extreme reading alone does not establish that a reversal has started.
How do traders set stop-loss orders for swing trades?
Traders usually place a stop-loss beyond the price level that would invalidate the setup. For a long trade, that may be below meaningful support or a recent swing low; for a short trade, above a relevant swing high. Then size the position based on the distance to the stop. During fast movement, a stop order may execute away from its trigger price, so planned risk and the actual exit price can differ.
How do you calculate risk-reward ratios and position size for swing trades?
Measure the potential loss from entry to stop and compare it with the distance from entry to target. Divide potential reward by potential risk to calculate the ratio. To size a position, divide the maximum amount you’re willing to risk by the loss per share or contract at the stop. Review correlated open positions together, since separate trades can expose your account to similar market moves.
How can traders use price targets and trailing stops to exit swing trades?
Set a target at a chart level or measured move that fits the setup, then decide whether to close the full position or take partial profits. A trailing stop can follow favorable movement while keeping an exit rule in place. Define what price structure will move the stop, such as a newly formed higher low in an uptrend. Don’t change the rule solely because a trade is approaching its target.


