

Finding stocks before they become popular starts with a repeatable filter, not a prediction. Screen for evidence of growth, then scan charts for constructive price action, moving-average trends, and momentum. A process can narrow a screen to 20 or 25 candidates before chart review reduces the list to three or four names worth researching further.
It’s easy to spot a stock after attention and price momentum have already built. A structured scan helps you look for earlier signals while keeping financial performance and risk in view. This guide explains how to set growth-screen criteria, read charts, assess moving averages and momentum, and research candidates using company reports and other information. The goal is a focused shortlist for further analysis, not a guarantee of future performance.
Key Takeaways
- Use chart patterns to narrow a broad screen to a focused shortlist, then review each candidate’s financial reports.
- Set growth and liquidity filters that match your approach, and compare company ratios with its industry.
- Read moving averages alongside momentum indicators to assess trend direction and possible overextension.
- Use AI-powered discovery, watchlists, and alerts to organize potential opportunities for further research.
Chart scanning
- Begin with a shortlist, not an open-ended chart search. A technical screen may narrow the field to 20 or 25 candidates, then chart scanning can reduce it to three or four names for deeper review. Open each chart at daily and weekly intervals. Look for a clear price structure, such as rising swing lows or a tight consolidation near a prior high. Record the pattern and the price level that would invalidate your reading.
- Mark support and resistance before interpreting a breakout. Support is an area where buying has previously interrupted a decline; resistance is where selling has capped advances. If a stock repeatedly stalls near a visible high, note whether it later closes above that area and holds. A brief intraday move beyond resistance is weaker evidence than a close that stays above the level.
- Use momentum indicators as context, not as automatic buy signals. A Relative Strength Index reading below 30 is often interpreted as oversold, while a stochastic oscillator reading under 20 may indicate oversold conditions and downside overextension. Check whether price is stabilizing or still making lower lows. A low reading during a persistent decline can reflect continuing weakness, rather than an imminent reversal.
- Compare price movement with trading volume on the chart. As a stock approaches resistance, observe whether volume expands during the advance or fades on a pullback. Then check for follow-through in subsequent price action. This sequence can help distinguish a developing move from a single sharp session. Keep chart settings consistent across candidates to make comparisons more useful.
- Connect chart moves to company events before treating a gap as a durable signal. According to the U.S. Securities and Exchange Commission, companies that trade publicly on national exchanges report earnings quarterly in an unaudited Form 10-Q. Review the reported period when a chart shows a sudden price gap. Note whether the move followed earnings, and assess subsequent price behavior instead of assuming one gap establishes a lasting trend.
Growth-stock screening
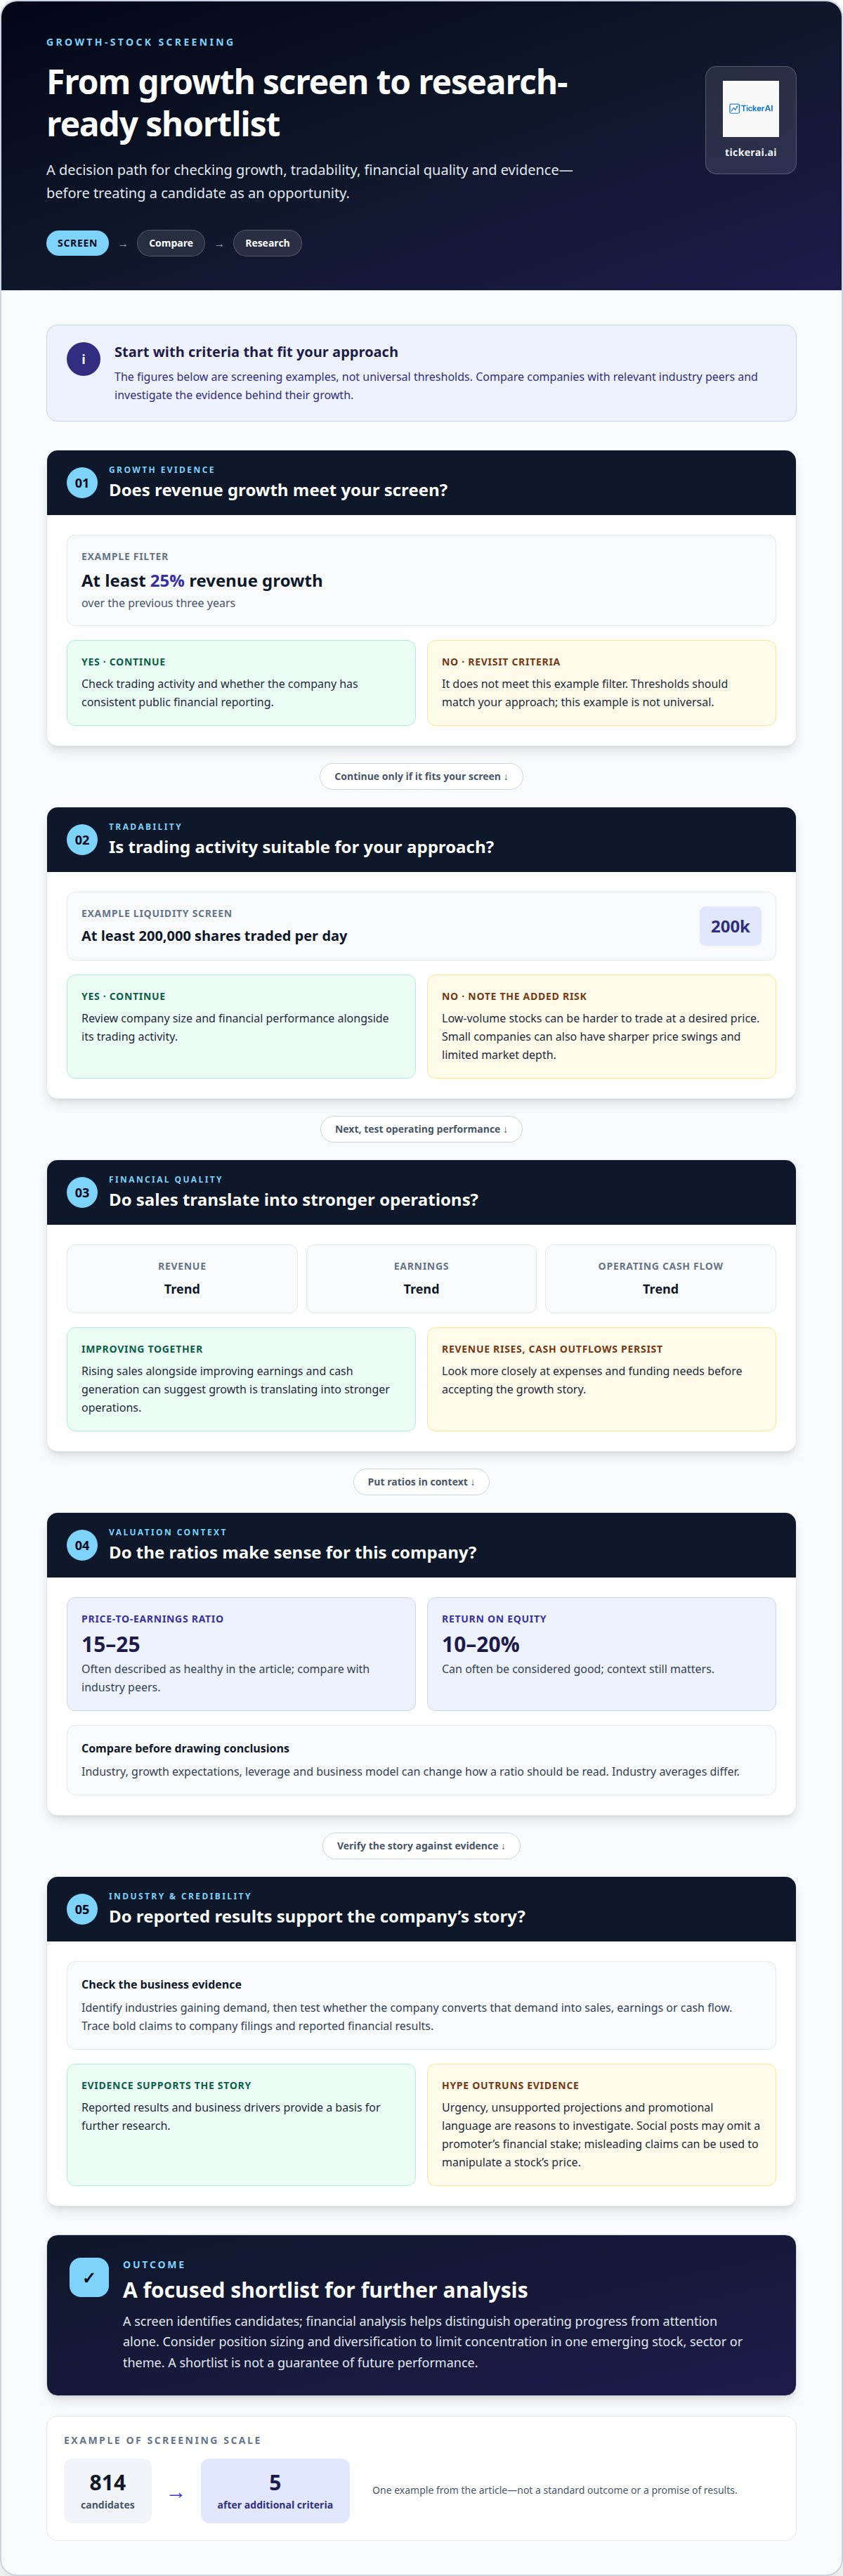
A disciplined approach to finding stocks before they become popular starts with measurable growth, financial quality, and tradability. Compare each screening result with its industry, then investigate the evidence behind its growth.
-
Screen Early-Stage Public Companies
Filter public companies by revenue growth, market capitalization, and trading activity to surface under-the-radar candidates. One example screen seeks at least 25% revenue growth over the previous three years; another applies additional criteria to narrow 814 candidates to five. Treat these as screening examples, not universal thresholds. Check whether the company has consistent public financial reporting and enough trading activity for your approach.
For liquidity, a technical screen may look for stocks trading at least 200,000 shares per day. Low-volume stocks can be harder to trade at a desired price, so assess trading activity alongside company size. Small companies can also face sharper price swings and limited market depth.
-
Check Earnings, Revenue, and Cash Flow
Compare revenue trends with earnings and operating cash flow across reporting periods. Rising sales alongside improving earnings and cash generation can suggest growth is translating into stronger operations. Rising revenue with persistent cash outflows calls for closer scrutiny of expenses and funding needs.
Review valuation measures in context. A price-to-earnings ratio between 15 and 25 is often described as healthy, while return on equity of 10-20% can often be considered good. Compare both with the company’s industry, growth expectations, leverage, and business model before drawing conclusions.
-
Assess Industries and Market Trends
Identify industries gaining demand, then test whether specific companies convert that demand into sales, earnings, or cash flow. For 2026, avoid treating a popular theme as proof of future growth; screen companies on reported results and the business drivers behind them. Industry averages differ, so compare financial ratios with relevant peers.
Consider exposure before buying. Position sizing limits how much any one emerging stock can affect a portfolio, while diversification across sectors and asset classes can reduce concentration in a single theme.
-
Separate Growth Potential from Hype
Trace bold claims to company filings and reported financial results. Social media posts and online forums may omit a promoter’s financial stake, and false or misleading claims can be used to manipulate a stock’s price. Treat urgency, unsupported projections, and promotional language as prompts to investigate the underlying evidence.
When finding stocks before they become popular, check whether revenue, earnings, and cash flow support the company’s story, and whether its trading activity suits your intended position. A screen identifies candidates; financial analysis helps distinguish operating progress from attention alone.
Moving averages and momentum
- Choose moving-average periods that match your intended holding window. A simple moving average uses closing prices across a defined period. Twenty days is a common starting point for traders. A 50-day or 200-day average gives a broader view of price-trend direction. Keep the selected periods consistent across charts, so comparisons between candidates remain useful.
- Check price against its moving average before interpreting a trend. A trader considering a long position might screen for a stock above its 20-day moving average. Then inspect whether that average is rising, flattening, or falling. A price above a declining average presents a different trend picture from one above a rising average.
- Compare short-term and longer-term averages for a crossover signal. A long-position screen might look for the 20-day moving average crossing above the 50-day average. For a short setup, a screen might require price below its 20-day average and the 20-day average below the 50-day average. Treat the crossover as one input, not a complete trade thesis.
- Read momentum indicators alongside the trend. The Relative Strength Index ranges from 0 to 100; readings above 70 are often interpreted as overbought. A stochastic oscillator above 80 may indicate overbought conditions and possible upside overextension. Neither threshold establishes that a reversal will follow. Compare the reading with price direction and recent movement.
- Use oscillator extremes to frame a question, not trigger an automatic entry. RSI below 30 is often interpreted as oversold, while a stochastic reading under 20 may signal downside overextension. Look for price stabilization before treating a low reading as a possible rebound setup. The stochastic %D line is a three-day moving average of its %K line, which can smooth short-term movement.
- Combine the signals into a consistent screen. For example, filter for price above its 20-day average and a rising 50-day average, then review momentum readings. If a stock sits above both averages but its stochastic reading exceeds 80, note the stretched momentum before acting. Record each signal and the time frame used; this makes later comparisons more disciplined.
Stock research sources
Use company filings to test a stock’s story against reported results. Read ownership and research disclosures in context, too.
-
Check SEC Filings and Disclosures
Start with the company’s quarterly and annual reports. According to the U.S. Securities and Exchange Commission, publicly traded companies on national exchanges report earnings quarterly in an unaudited Form 10-Q. Review the audited Form 10-K for a longer view.
Read the business overview, risk discussion, and income statement in company filings. The income statement shows sales and revenue, expenses, and before-tax earnings. Compare reporting periods to see whether growth aligns with the company’s narrative. Research from FINRA-registered broker-dealers must disclose conflicts of interest clearly, comprehensively, and prominently. FINRA rules also prohibit certain conduct when conflicts are too pronounced for disclosure to address.
-
Track Insider and Institutional Ownership
Review disclosed ownership changes alongside company performance and filing dates. Insider buying can be a useful research signal because it shows company insiders increasing their exposure. Changes in institutional ownership may indicate that professional investors are reassessing a company, but neither signal explains the reason on its own. Compare ownership changes with operating results, reported risks, and the company’s stated business plans.
Look for a pattern, not a single transaction or ownership shift. Ask whether the reported change coincides with improving revenue, earnings, or cash flow, and whether the thesis still fits the filings. A stock with rising institutional ownership can still face business risks. Limited institutional attention may reflect company size or trading activity, not hidden value. Treat ownership as context for further analysis, not as a standalone buy signal.
To streamline candidate discovery alongside filing reviews, organize stock opportunity research around your screening criteria.
TickerAI: AI Stock Opportunity Discovery
TickerAI’s AI Stock Opportunity Discovery helps turn a broad stock scan into a more manageable stream of opportunities. Use it to identify potential market movements after setting your own criteria and reviewing company fundamentals.
For shorter-term strategies, Swing Trade Setups can surface candidates to assess alongside chart signals and momentum. Smart Watchlist & Alerts help you track selected stocks as conditions change. For a longer horizon, Long-Term Investment Ideas provide another way to explore candidates for further research.
These tools support discovery and monitoring; they don’t replace your own research or investment decisions. Explore TickerAI’s stock opportunity discovery to find candidates for your research process.
Turn your screening process into a repeatable practice
Finding stocks before they become popular is best treated as an ongoing research discipline, not a one-time hunt for a hidden winner. Record why each company entered your watchlist, what evidence would strengthen its case, and what new information could change your view. This helps separate a developing thesis from a reaction to short-term market noise.
Use each review to refine your criteria. A candidate that no longer fits your financial or trading framework can leave the list; a company with relevant new evidence can move forward for closer analysis. TickerAI’s AI Stock Opportunity Discovery, Swing Trade Setups, and Smart Watchlist & Alerts support opportunity discovery and monitoring, complementing your own research and decision-making.
Ready to explore how these tools fit your process? Contact TickerAI to explore your options. Keep your criteria clear, stay curious, and let evidence guide your next step.
Frequently Asked Questions
What are effective ways of finding stocks before they become popular?
A repeatable process for finding stocks before they become popular combines company screening with ongoing research. Start with measurable business performance, then monitor whether new filings support the growth case. Compare candidates with industry peers and note changes that could weaken the thesis. This keeps the focus on evidence and company fundamentals rather than headlines or sudden bursts of online discussion.
What tools and data sources help investors research lesser-known stocks?
Stock screeners help filter candidates by growth, valuation, and trading activity. Company filings provide reported performance, business details, and risk disclosures, while charting tools and watchlists help track changes over time. For finding stocks before they become popular, TickerAI’s AI Stock Opportunity Discovery can surface candidates for further investigation. Use those insights as a starting point, then assess each company’s underlying information.
Which industries or market trends may produce emerging growth stocks in 2026?
Industries seeing rising demand may produce promising candidates, but a popular theme alone is not proof of growth. Check whether companies convert that demand into reported sales, earnings, or cash flow.


