

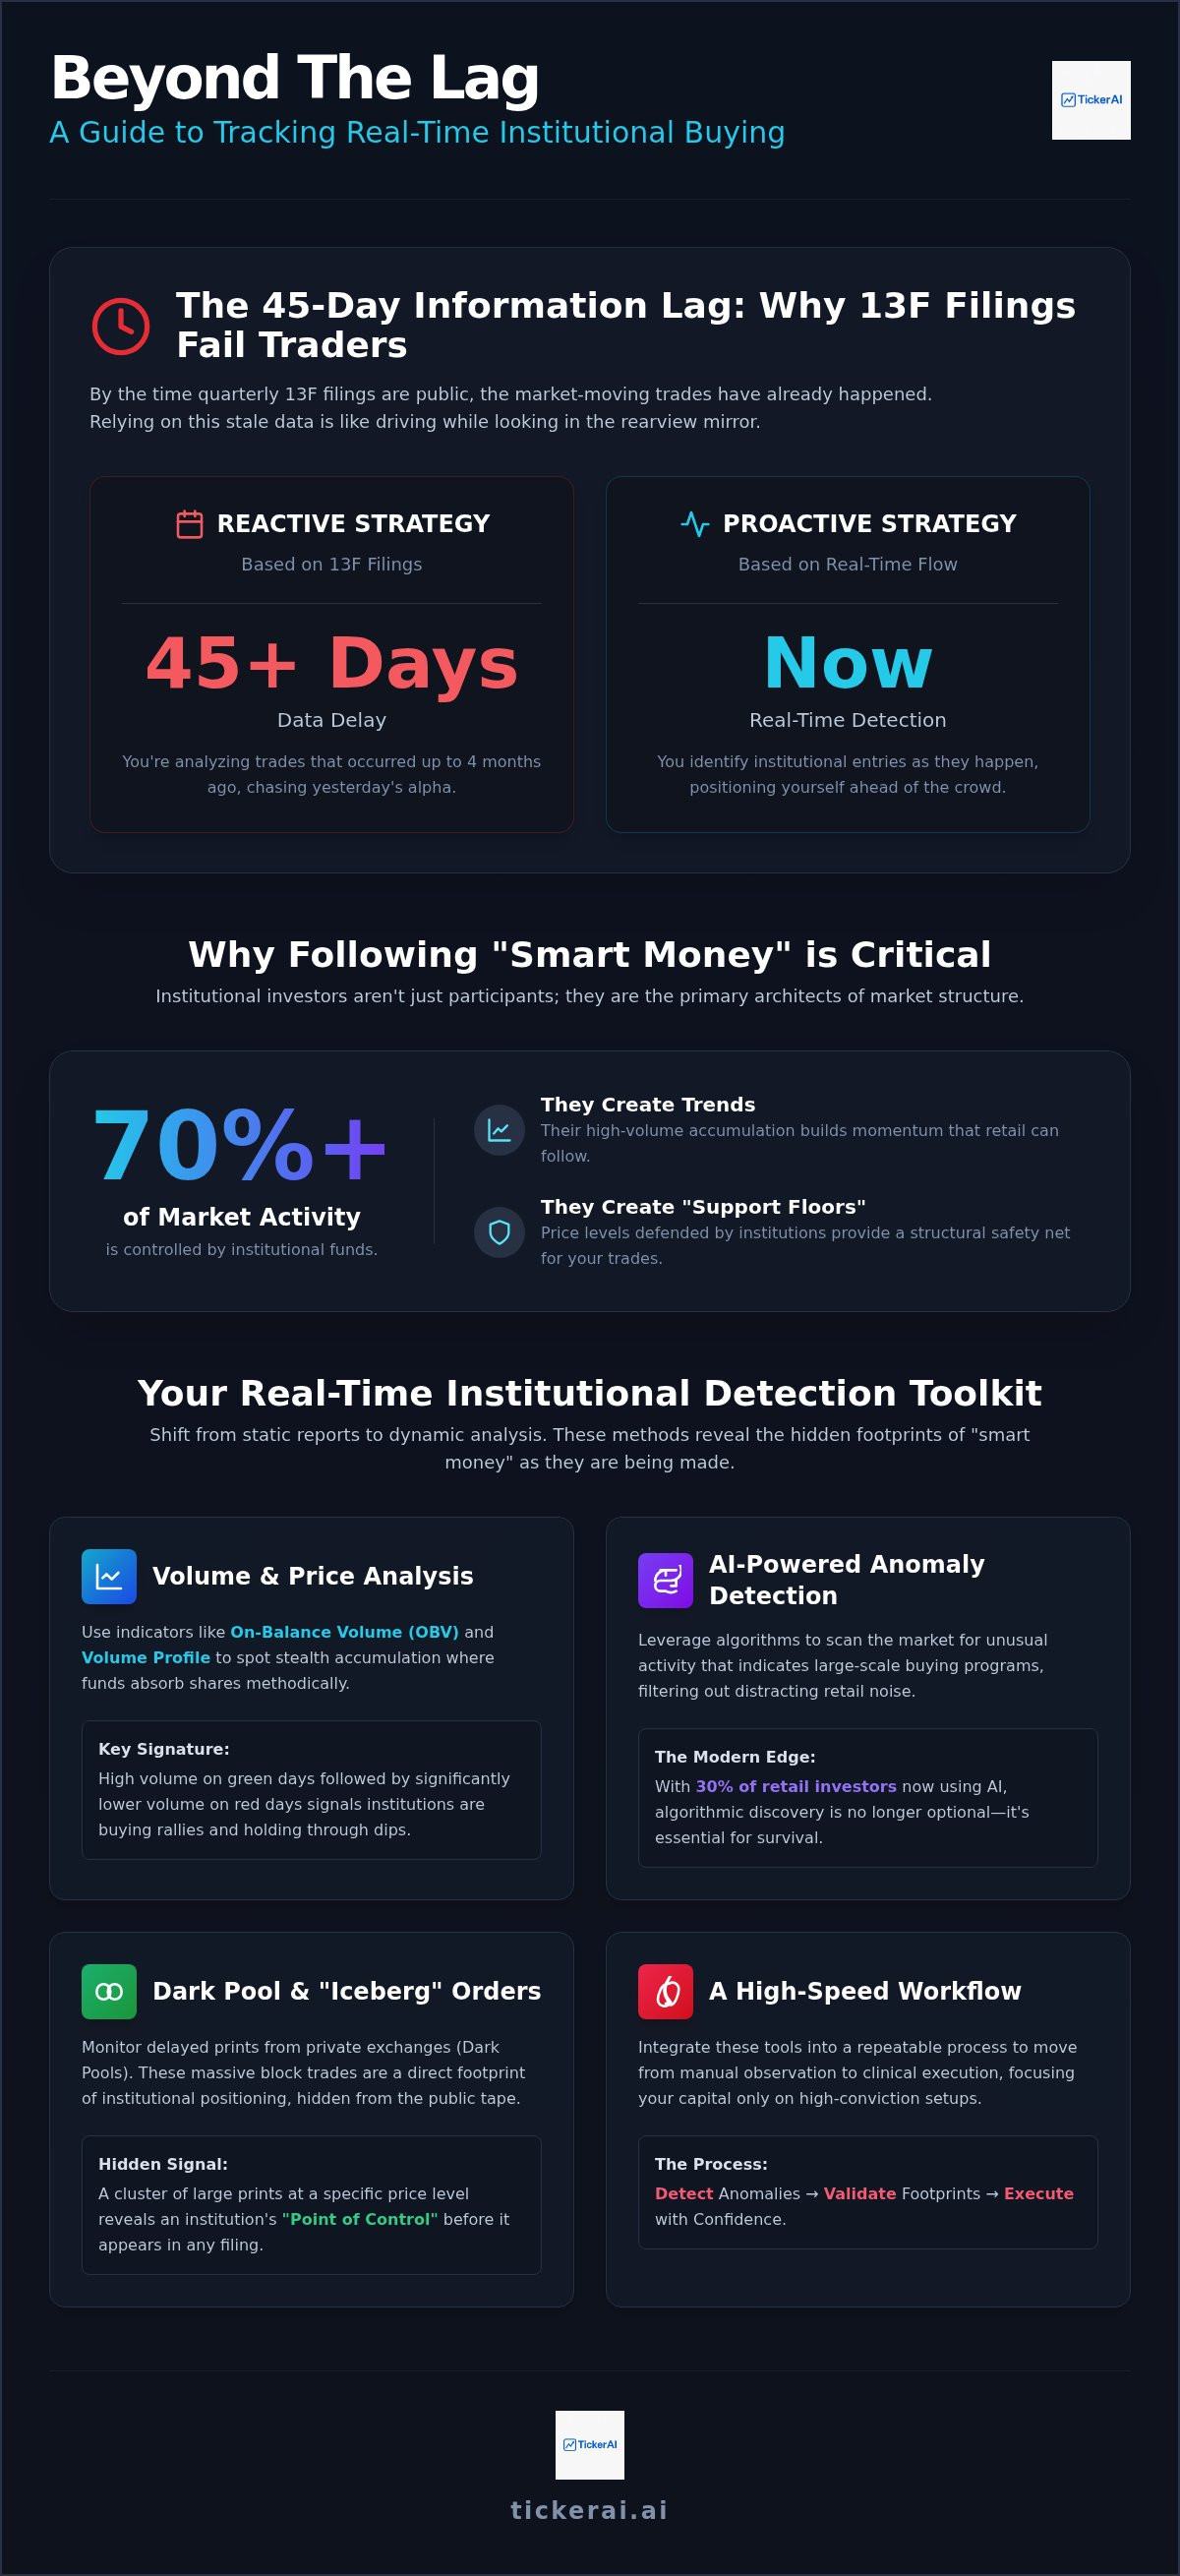
Why are you still trading on data that's 45 days old? By the time the SEC publishes Q1 13F filings on May 15, 2026, the smart money has already moved. Relying on stale filings for finding stocks with institutional buying is a strategy for chasing yesterday's alpha. It's inefficient. It's reactive. In a market where 30% of retail investors now use AI tools to gain an edge, speed is your only real currency.
You know that tracking big money flow is the most reliable way to identify high-conviction moves. Yet, the lag between institutional execution and public disclosure makes most traditional methods obsolete. This guide bridges that gap. You'll learn the specific technical and algorithmic methods used to detect where hedge funds are deploying capital right now. We're moving past manual scans and outdated reports.
We'll detail a repeatable workflow for smart money discovery that utilizes AI to filter out retail noise. By the end of this professional guide, you'll be able to identify institutional entries early and focus your capital on high-potential setups before the crowd follows. Let's upgrade your discovery process from manual observation to clinical execution.
Key Takeaways
- Bypass the 45-day information lag of 13F filings by shifting from static reports to real-time algorithmic anomaly detection.
- Identify hidden accumulation phases using specific technical indicators like Volume Profile and On-Balance Volume (OBV) to spot smart money activity.
- Develop a repeatable, high-speed workflow for finding stocks with institutional buying that eliminates the manual burden of scanning thousands of filings.
- Leverage institutional "support floors" to validate high-conviction entries and improve the precision of your swing trade setups.
- Utilize AI-driven discovery to filter out retail noise and isolate the highest-conviction institutional moves across global markets.
The Institutional Footprint: Why Smart Money Drives Market Momentum
Institutional buying is the high-velocity accumulation of shares by entities wielding professional-grade capital. These participants, including hedge funds, pension funds, and investment banks, are the primary architects of market structure. In the current environment, an institutional investor typically commands a massive share of total daily volume. Estimates consistently show that these organizations control over 70% of all market activity. When they move, the market shifts. For the individual trader, finding stocks with institutional buying is not just an advantage; it's a prerequisite for survival in a liquidity-driven market.
Tracking these flows remains the most reliable method for identifying high-probability swing trade setups. Institutions do not trade on whim or social media sentiment. They operate on deep fundamental research and sophisticated risk models. Their entry into a ticker creates a "support floor." These floors act as a safety net for your risk management. If a multi-billion dollar fund is defending a specific price level, your stop-loss has a structural reason to hold. You aren't just betting on a price; you're piggybacking on a professional conviction.
The Mechanics of Institutional Accumulation
Large funds face a unique problem: liquidity. They cannot enter a multi-million dollar position in a single trade without causing massive slippage. This would alert the entire market and destroy their entry price. Instead, they utilize "Iceberg Orders." These are massive buy programs broken into thousands of smaller, automated executions. This process creates a recognizable footprint on the tape. Stealth accumulation often manifests as tight price consolidation accompanied by steady, above-average volume. The goal is to absorb every available share without spiking the price. This methodical absorption builds the energy required for the eventual breakout.
Market Impact vs. Retail Noise
Distinguishing between sustained institutional interest and retail-driven noise is critical for capital preservation. Retail "pumps" are characterized by erratic price spikes on low relative volume, often lacking follow-through. Smart money creates trends. It is the difference between a temporary flash flood and a rising tide. To spot the difference, observe the volume-price relationship over several days. High volume on green days followed by significantly lower volume on red days is a classic sign of accumulation. The institutions are buying the rallies and holding through the dips. They are establishing long-term price trends that retail traders can ride for significant gains. By filtering out the noise, you focus on the tickers where the heaviest capital is already committed.
Decoding 13F Filings and the 45-Day Information Lag
Institutional investment managers with over $100 million in qualifying assets must disclose their long positions quarterly via SEC Form 13F. These reports are accessible through the SEC EDGAR Database. While these filings are a primary source for finding stocks with institutional buying, they come with a significant structural flaw: the 45-day reporting lag. For the first quarter of 2026, the filing deadline is May 15, 2026. This means the data you're analyzing could be up to four months old. For a swing trader, this information is often "dead on arrival."
The strategic value of 13F data lies in identifying broad thematic shifts rather than timing precise entries. Use these filings to spot clusters of activity across multiple elite funds. If five top-tier hedge funds simultaneously increased their exposure to a specific sub-sector last quarter, you've identified a high-conviction macro trend. This provides the fundamental "why" behind a move, even if the "when" requires more real-time technical validation.
The Dark Pool Factor
Institutions frequently execute massive block trades in Dark Pools to minimize market impact. These private exchanges allow funds to buy or sell without immediately appearing on the public tape. In 2026, sophisticated traders must monitor "delayed prints" or "dark pool prints." These are trades that have already occurred but are reported to the consolidated tape with a delay. Spotting a cluster of massive prints at a specific price level often reveals the "Point of Control" where an institution is establishing a major position. It's a hidden footprint that precedes public filings.
Correlating Filings with Real-Time Price Action
To gain a speed advantage, shift your focus to Schedule 13D and 13G filings. These are required when an entity acquires more than 5% of a company's outstanding shares. Because these are event-driven rather than calendar-driven, they often provide a much faster signal than the quarterly 13F. While a 13F is a broad quarterly summary of all long positions, a 13D is an event-driven disclosure triggered specifically by a significant ownership stake. Cross-referencing these filings with current price action helps you identify which funds have the highest "alpha" in the current cycle. You can streamline this discovery by integrating Smart Watchlist & Alerts into your daily routine to catch these filings the moment they're processed. This turns a manual research chore into a high-speed intelligence workflow.
Technical Indicators That Reveal Institutional Accumulation
Institutional accumulation isn't visible through basic moving averages or retail sentiment. It requires an analytical lens that filters for heavy capital conviction. While retail traders often focus on price action alone, professionals look for the volume-price relationship to reveal where big money is most active. For the purpose of finding stocks with institutional buying, you must move beyond the standard volume bars found on most charting platforms. You need tools that quantify the velocity and location of capital flow.
The Volume Profile is your most critical tool for this task. It identifies the "Point of Control" (POC), which is the price level where the highest volume was transacted over a specific period. This POC represents institutional "fair value." When price returns to this level, expect heavy defense from the funds that established their positions there. Observation: Price tests a high-volume node. Action: Identify this as a structural support floor for your risk management.
On-Balance Volume (OBV) and the Accumulation/Distribution Line provide the necessary confirmation of silent accumulation. OBV reveals divergences. If a stock's price is moving sideways but OBV is trending higher, institutions are absorbing shares without moving the needle. The Accumulation/Distribution Line takes this further by quantifying where the stock closes relative to its daily range. A series of closes in the upper 25% of the daily candle on high volume is a clinical signal of institutional commitment. To catch these moves as they happen, set Block Trade Alerts for single trades exceeding a $1 million threshold. These are the immediate footprints that precede any public filing.
The VCP Pattern: Volatility Contraction
Volatility Contraction Patterns (VCP) signal that supply is drying up. As price swings get tighter on the right side of a base, it shows that weak retail hands have been shaken out. Institutions have absorbed the remaining float, leaving the stock ready for a major breakout. Detecting this "tightness" in price action is a key step in finding stocks with institutional buying before the retail crowd follows. You can streamline this process by automating stock market research to identify these tightening patterns across thousands of tickers in real-time.
Relative Strength vs. The Benchmark
Relative Strength (RS) is the ultimate institutional filter. Institutions hide in stocks that refuse to go down during market corrections. Calculate RS by comparing a ticker's performance directly against the S&P 500. If the benchmark is down 2% but your target ticker is flat or up, institutional support is present. Using AI to scan for RS anomalies across 5,000+ tickers simultaneously allows you to isolate leading sectors before they breakout. It's a proactive way to find where the smart money is already positioned during times of market stress.
Manual Research vs. Algorithmic Discovery: Scaling Your Strategy
Manual research is a legacy bottleneck. Sifting through SEC filings, scanning charts, and cross-referencing news feeds for every ticker is an inefficient use of a trader's time. This "Manual Trap" forces traders into a reactive state where they're always one step behind the smart money. By the time you've manually identified a setup, the institutions have often already completed their accumulation phase. For finding stocks with institutional buying, speed is the only real barrier to entry. Algorithmic filtering shifts the heavy lifting from the human to the machine. AI detects anomalous volume spikes and price-volume divergences in milliseconds across the entire market. It sees the subtle footprints that the human eye misses during a manual scan.
Algorithms can detect "anomalous volume" faster than any human chartist. While a professional might scan 50 charts an hour, an AI scans the entire exchange every second. It identifies the micro-structure of "Iceberg Orders" by analyzing the tape for repetitive, hidden buy programs. This allows for the discovery of institutional entries as they happen, not weeks later when the 13F filing is finally public. Observation: A ticker shows a 300% volume increase with minimal price movement. Action: The algorithm flags this as a potential hidden accumulation for immediate review. This is how you move from being a passenger in a trend to being an early participant.
Designing a Repeatable Investment Workflow
A professional strategy requires a modular, sequential process. You can't rely on random discoveries or social media tips. Scale your discovery with this structured, three-step workflow:
- Step 1: Automated Scanning. Use AI to monitor institutional footprints and dark pool prints across 5,000+ tickers in real-time. This eliminates the noise of low-conviction tickers.
- Step 2: Catalyst Verification. Filter these results for high-conviction drivers using AI for tracking stock catalyst events. This step ensures that the institutional volume has a logical, fundamental reason behind it.
- Step 3: Rule-Based Execution. Execute entries only when technical price action aligns with the detected institutional flow.
Eliminating Emotional Bias with AI
Traders often "marry" a stock despite clear signs of institutional distribution. They ignore the tape because they've fallen in love with a company's narrative or past performance. AI alerts provide a clinical, data-driven perspective that ignores these stories. If the smart money is exiting, the algorithm signals the shift without hesitation. This systematic discovery is vital in a 2026 market where approximately 30% of retail participants already use advanced tools to gain an edge. You need a proactive scout that prioritizes information while you focus on high-level decision-making. To bridge the gap between raw data and professional execution, start with a TickerAI Pro Subscription. It transforms a chaotic environment into a streamlined list of high-potential setups.
Accelerating Discovery with TickerAI’s Institutional Flow Analysis
The transition from manual scanning to algorithmic discovery is the defining shift for traders in 2026. TickerAI’s proprietary AI engine operates as a tireless scout, scanning the tape for institutional accumulation in real-time. This technology bypasses the structural delays of public filings. It detects the subtle price-volume anomalies that signal large-scale entries before they become obvious to the retail crowd. For the professional participant, finding stocks with institutional buying is no longer a matter of luck or tedious filing reviews. It's a result of high-speed data processing and clinical execution.
Real-time alerts trigger the moment institutional volume correlates with technical price breakouts. This ensures you're alerted to high-conviction moves while the risk-to-reward ratio is still favorable. To maintain this algorithmic edge, the TickerAI Pro Subscription and TickerAI Full-Access Subscription provide the depth of data required for serious market participation. These tiers offer granular insights into order flow dynamics that were previously the exclusive domain of institutional desks. You aren't just getting data. You're getting prioritized intelligence.
TickerAI Smart Watchlists: Your Institutional Scout
TickerAI’s Smart Watchlist & Alerts filter out "fake" volume to focus on high-conviction institutional moves. Not all volume is equal. Retail-driven spikes often lack the capital depth to sustain a trend. Our algorithms distinguish between these chaotic retail pumps and the methodical absorption characteristic of smart money. You can customize these alerts for specific sectors or market caps, such as small-cap institutional discovery. To validate these setups, the platform integrates automated earnings report analysis. This allows you to confirm that the institutional volume aligns with fundamental growth catalysts. Observation: Institutional buying spikes. Action: Cross-reference with earnings sentiment to confirm the thesis.
Conclusion: Building Your 2026 Edge
Institutional tracking is not about blind copying. It's about identifying momentum early and managing risk based on structural support floors. In 2026, approximately 30% of retail investors are using AI tools to navigate the markets. This increased competition makes speed and precision non-negotiable. Leveraging AI tools allows you to scale your research and drastically reduce time spent on manual discovery. You focus on decision-making while the machine handles the surveillance. The goal is a repeatable, data-driven workflow that removes emotional bias and prioritizes high-probability setups. Explore TickerAI’s institutional discovery tools today to secure your algorithmic advantage.
Securing Your Algorithmic Advantage
The market doesn't wait for public filings. Success in 2026 requires a shift from reactive 13F analysis to proactive, real-time discovery. By moving past the 45-day reporting lag and focusing on structural volume-price anomalies, you align your capital with the market's most powerful participants. Finding stocks with institutional buying is no longer a manual chore. It's a clinical process of detecting the footprints of smart money as they are made on the tape. You've learned how to identify the Point of Control and how to filter for Relative Strength anomalies. Now, it's time to scale that knowledge.
Transition from manual scanning to automated intelligence today. Leverage AI-driven real-time market alerts and smart watchlists for high-potential swing trades. This clinical, data-driven approach removes emotional bias and prioritizes high-conviction setups across global exchanges. Discover stocks with institutional momentum using TickerAI Full-Access and secure a sophisticated edge in your discovery workflow. The data is live and the opportunity is clear. Take control of your execution and trade with the confidence of an institutional professional.
Frequently Asked Questions
Is institutional buying a guarantee that a stock will go up?
No, institutional buying is not a guarantee of price appreciation. While large-scale accumulation creates structural support floors, institutions often buy for reasons beyond simple speculation, such as index rebalancing or complex hedging. They can be wrong. Always cross-reference institutional flow with technical breakouts and fundamental catalysts to confirm the setup before committing capital.
How often are 13F filings updated in 2026?
13F filings are updated quarterly by managers exercising discretion over at least $100 million in qualifying assets. In 2026, the specific filing deadlines are February 17, May 15, August 14, and November 16. Because these filings are due 45 days after the quarter ends, the data represents a historical snapshot rather than a real-time portfolio. This lag makes the data less effective for high-velocity swing trading.
Can I see institutional buying in real-time without expensive software?
You can detect institutional footprints through standard volume-price analysis, though it is less efficient than using algorithmic tools. Look for high-volume nodes on a Volume Profile or significant OBV breakouts. These technical signals suggest high-conviction participation. However, identifying the specific entity behind the move without specialized software requires manual cross-referencing of 13D and 13G filings, which are event-driven and faster than 13F reports.
What is the difference between institutional buying and insider buying?
Institutional buying involves external professional entities like hedge funds and banks. Insider buying refers to purchases made by a company’s own officers, directors, or major shareholders. Both are bullish signals, but they represent different types of conviction. Insiders have intimate knowledge of company operations, while institutions represent the smart money flow that provides the liquidity and momentum required for long-term price trends.
How do Dark Pools affect my ability to track institutional buying?
Dark Pools allow institutions to execute massive block trades privately to avoid immediate market impact. This hides their initial footprint from the public consolidated tape. For those finding stocks with institutional buying, this creates a visibility gap. You must look for delayed prints or significant volume spikes at specific price levels to detect these hidden entries before they are officially reported in quarterly filings.
What technical indicator is best for spotting institutional accumulation?
The Volume Profile is the most effective indicator for spotting institutional accumulation. It identifies the Point of Control where the highest volume was transacted, revealing where big money is most active. On-Balance Volume (OBV) is also essential for spotting divergences where the price stays flat while volume rises. These indicators provide a clinical view of the capital flow that precedes a major breakout.
How does TickerAI detect institutional activity compared to traditional screeners?
TickerAI utilizes algorithmic anomaly detection to identify institutional footprints in real-time, whereas traditional screeners rely on static, historical data. Our system scans for repetitive buy programs and Iceberg Orders that manual filters miss. By correlating volume spikes with technical price action and catalyst events, it provides actionable intelligence. This proactive approach eliminates the 45-day lag associated with standard 13F tracking methods.
Is institutional tracking effective for small-cap stocks?
Institutional tracking is highly effective for small-cap stocks because their lower float makes institutional entries more impactful. When a fund takes a position in a small-cap ticker, the resulting supply absorption often leads to rapid price appreciation. finding stocks with institutional buying in the small-cap space requires monitoring 13D filings and real-time block trade alerts, as these moves often precede broader market awareness.


