

Volatility creates opportunity only when a stock can support a workable trade. Swing trading aims to capture price moves across multiple sessions. Finding volatile stocks for swing trading means screening for movement alongside liquidity, share price, volume, and float.
A fast-moving ticker may look attractive, but sharp price swings alone don’t make it a strong candidate. Thin trading can make entries and exits harder, while share price and available float help explain how a stock may respond to buying or selling pressure.
This guide explains how swing trading works and how each filter narrows the field. Learn how volatility indicators, trading activity, share price, and float fit together to assess potential setups with a clearer, more disciplined process.
Key Takeaways
- Swing trades target price moves that develop across multiple sessions; news and earnings can create catalysts worth assessing alongside chart behavior.
- Combine ATR, price change, trading volume, and float to distinguish active candidates from stocks that move sharply but may be difficult to trade.
- Use liquidity and share-price filters to narrow a scan, then assess whether a stock’s trading activity supports practical entries and exits.
- Confirm volatility with chart evidence and a clear setup, rather than treating a dramatic move as a signal on its own.
What Is Swing Trading?
Swing trading seeks to capture a price move over several trading sessions. A trader identifies a setup, defines where it fails, and plans an exit. Unlike intraday trading, a position may remain open overnight, making earnings dates and breaking news relevant. A catalyst can shift expectations quickly, but volatility alone doesn’t establish a trade. The chart still needs a clear structure.
For volatile stocks, set a stop near the price level that would invalidate the setup, such as support, resistance, or VWAP. Size the position by dividing the amount you’re prepared to risk by the distance between entry and stop. A wider stop therefore means fewer shares for the same planned risk. A stop order’s execution isn’t guaranteed at or near its stop price, and investing can result in losses, including loss of principal.
News catalysts can create momentum or reverse an established move. Earnings announcements are a common event to track because a company’s results or outlook can change how traders value its shares. For example, a stock may gap above resistance after an earnings release, then hold that level as buyers enter. If it quickly falls below resistance, the breakout may lack follow-through. Weigh the catalyst against price action, trading volume, and the planned exit. A headline is context, not a signal by itself.
Relative strength compares a stock’s performance with a benchmark or its sector. It differs from absolute price movement: a stock can rise while still underperforming the broader market. Strong relative strength can help identify U.S. stocks holding up better than peers, while weak relative strength can flag laggards. One screen for listed U.S. high-relative-strength stocks uses daily average volume above 1 million shares and a share price above $15. These are screening criteria, not proof that a stock will continue outperforming.
For swing traders, the goal is a defined setup with manageable exposure, not simply the biggest daily move. Compare the catalyst, relative strength, chart levels, and risk plan before considering a volatile stock as a candidate.
How professionals screen for ATR, price change, volume, and float
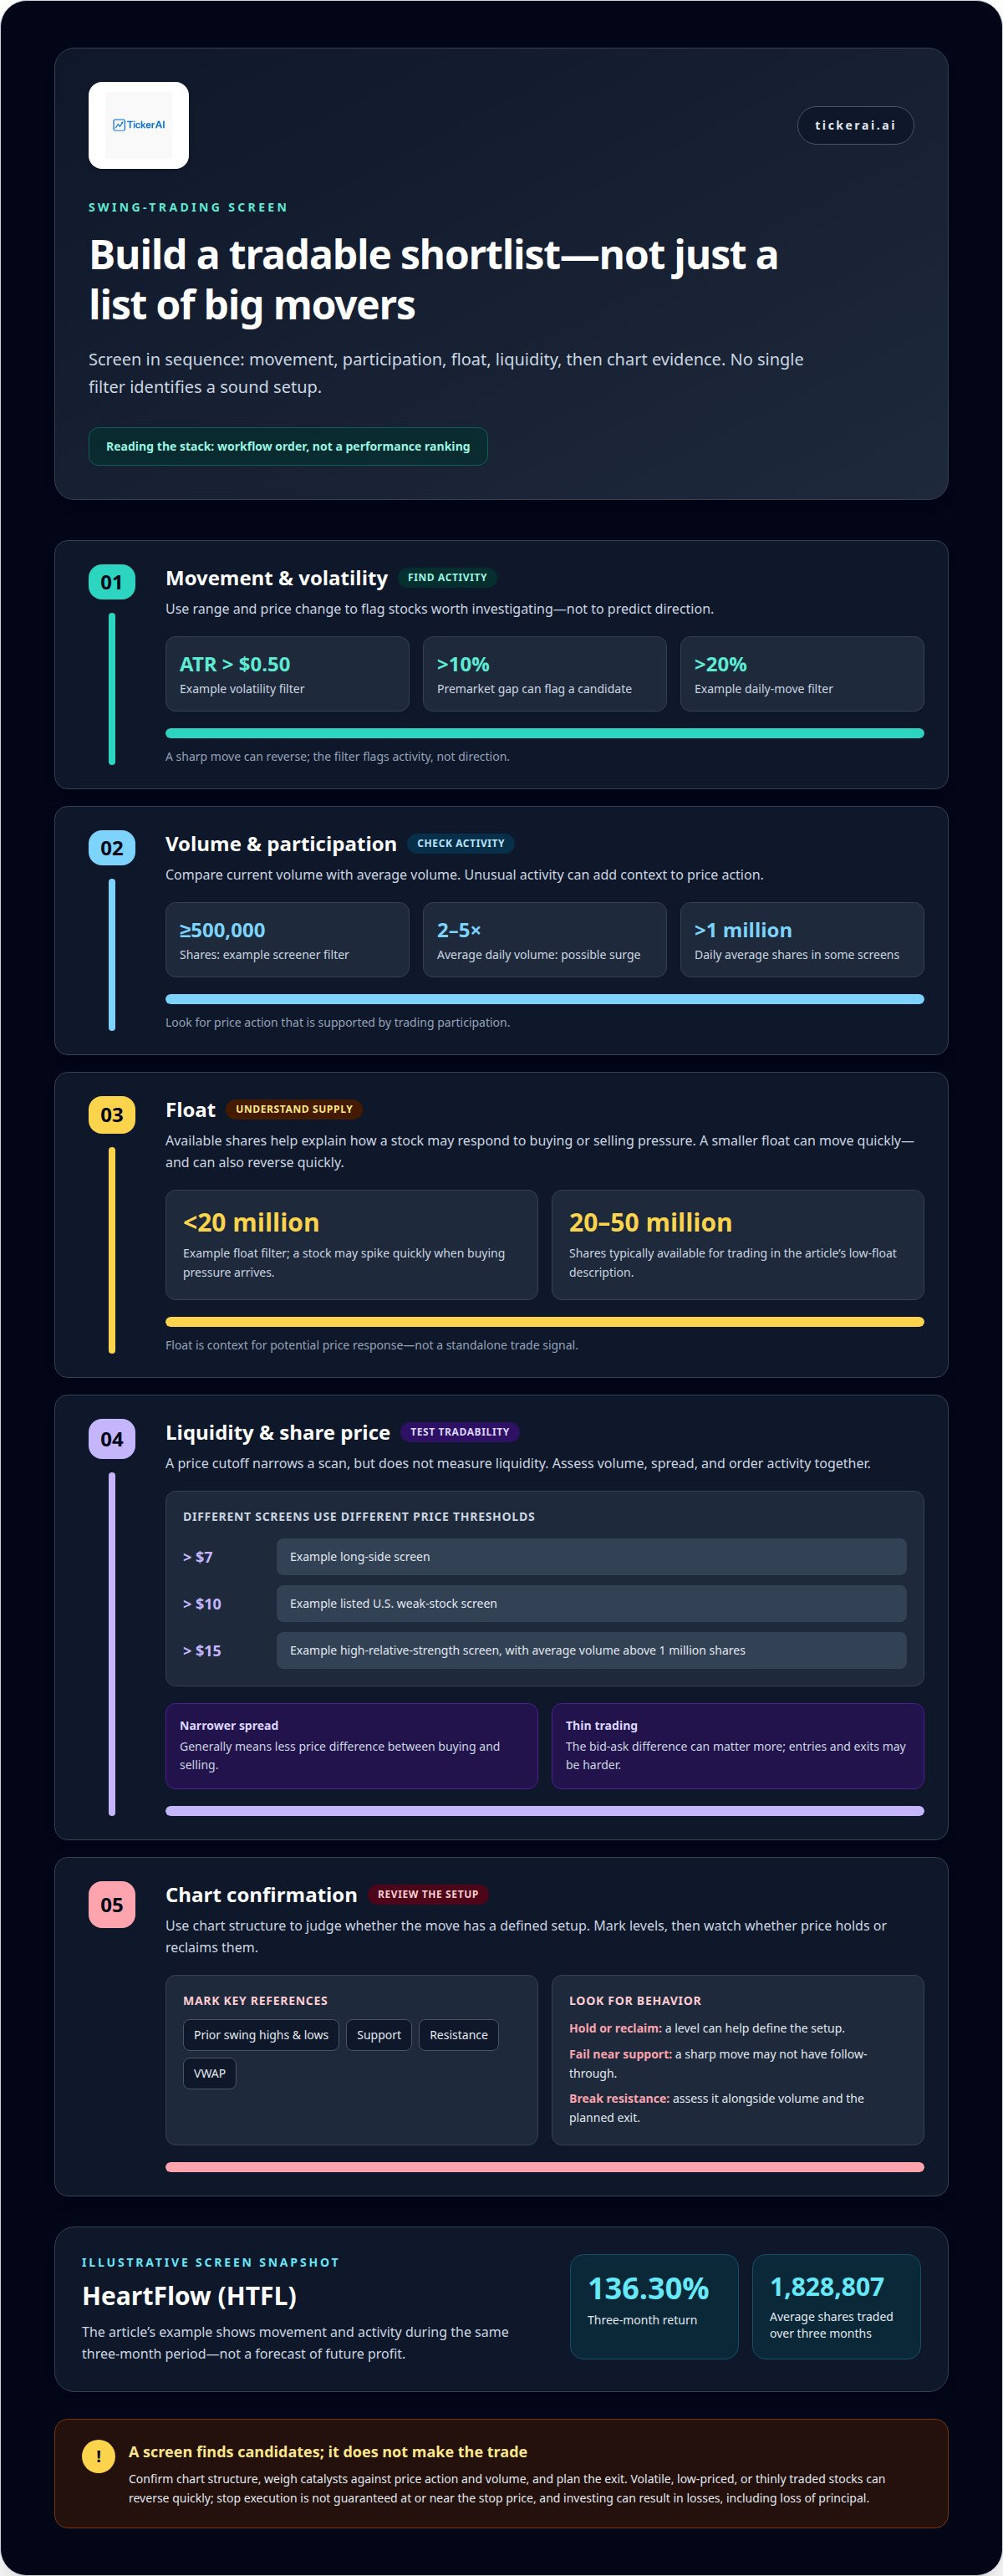
Effective screens combine price range, movement, trading activity, and float. No single filter identifies a sound setup. Comparing these signals helps distinguish a sharp move from a trend supported by participation.
Returns and Average Trading Volume
Three-month return shows how far a stock’s price has moved, while average trading volume measures its typical share turnover. Together, they provide context on trend and activity.
For example, HeartFlow (HTFL) had a 136.30% three-month return and average trading volume of 1,828,807 shares over three months. Those figures indicate substantial movement and activity during that period, not a forecast of future profit. Professionals compare current volume with the stock’s average, then assess whether price action supports the move.
How professionals use unusual volume and price action to confirm stock opportunities
Unusual volume means trading activity has risen above its normal level. Paired with price action, it can strengthen a scan signal. A stock trading two to five times its average daily volume may be experiencing a surge in activity.
Professionals then examine whether price is breaking through resistance, reclaiming a key level, or failing near support. A premarket gap above 10% or a daily move greater than 20% can flag candidates for closer analysis. These filters identify activity, not direction: a sharp move can reverse, so the level’s behavior matters.
How professionals use stock screeners and identify technical support and resistance levels
For volatile U.S. stocks, a screener can combine ATR, daily price change, volume, and float. Example filters include ATR above $0.50, volume of at least 500,000 shares, or a move exceeding 20% on the day. A float under 20 million shares may spike quickly when buying pressure arrives; low-float stocks typically have 20 to 50 million shares available for trading.
Free U.S. screeners can narrow the field, but chart levels help assess whether a candidate has a defined setup. Professionals mark prior swing highs and lows, support, resistance, and VWAP, then look for price to hold or reclaim a level. AI-powered stock opportunity discovery can support the process of surfacing candidates for review.
How professionals assess liquidity and share-price thresholds
Assess trading volume, liquidity, and the bid-ask spread together. Compare current and average volume, then examine whether the spread and order activity support practical entries and exits. A narrow spread generally means less price difference between buying and selling. In a thinly traded stock, that difference can matter more.
Share-price cutoffs depend on the screen’s purpose, not a universal rule. One listed U.S. weak-stock screen uses a share price above $10 and daily average volume above 1 million shares. A separate long-side screen uses prices above $7. These examples show how strategies can apply different thresholds to define their candidate pool.
A price filter helps structure the search, but doesn’t measure liquidity by itself. Check whether volume is consistent or concentrated in a brief burst, and whether price patterns hold as buying and selling continue. A stock with substantial activity may still have an uneven spread or unstable price action. That combination can make it harder to open or close positions at intended levels.
For a volatile candidate, assess whether trading activity can support the planned position. Compare the spread during active trading with quieter periods, and observe whether volume accompanies movement through key chart levels. A breakout on stronger participation offers clearer context than a price jump on sparse trading. These observations help separate usable setups from movement that may be difficult to trade.
Low-priced, small-cap, or highly volatile stocks can move sharply, reverse quickly, and expose a position to larger losses. A wide spread can also increase the difference between the quoted price and the price available when an order executes.
Treat price thresholds as screening tools, not trade signals. Weigh spread behavior, volume consistency, chart patterns, and position size together. A candidate that passes a price filter but lacks reliable liquidity may not suit a strategy that requires controlled entries and exits.
How professionals find stocks for swing trading
Finding volatile stocks for swing trading starts with measuring movement, then testing whether the chart supports a trade idea. Use Average True Range (ATR), Bollinger Bands, and beta to assess different aspects of volatility. ATR reflects a stock’s recent trading range; Bollinger Bands show how price moves relative to its recent average; beta compares its movement with the broader market. Together, these measures help distinguish active opportunities from quiet patterns with little room to move.
Price alone doesn’t define a useful candidate. Stocks priced from $1 to $10 per share can lead volatility screens, and some may move 10% to 50% in one session. That movement can attract attention, but it also makes entry timing and position exposure more sensitive to price swings. A stock with a 10-cent all-day range, by contrast, may offer little room for a swing setup. Professionals compare expected movement with the chart’s levels and the intended holding period.
Research adds context. A news catalyst can explain why a stock is moving, but look for chart evidence before treating it as a potential setup. A breakout pattern or reclaim of a key level can support the case that buyers are responding to the catalyst. If the price fails to hold that level, the headline alone doesn’t establish a clear opportunity. Consider the catalyst, volatility measures, and price behavior together rather than relying on one signal.
This is a filtering process, not a prediction of profit. Professionals narrow a broad universe to stocks whose movement, catalyst, and chart structure align with a defined strategy. Leverage can magnify exposure, so it doesn’t replace a clear risk plan. For AI-powered screening that surfaces potential candidates, explore stock opportunity discovery.
TickerAI: AI Stock Opportunity Discovery
TickerAI helps traders surface potential market opportunities through AI Stock Opportunity Discovery. When screening produces too many candidates to monitor, Swing Trade Setups offer curated ideas for further analysis. Smart Watchlist & Alerts help organize tickers and track market movements, while Long-Term Investment Ideas support research into opportunities beyond swing trades.
These tools support discovery and monitoring; they don’t replace your evaluation of volatility, liquidity, chart levels, and risk. A stock in a setup still needs to fit your strategy and position plan. Use the signals as research inputs, not as a substitute for disciplined decision-making.
Contact TickerAI to explore its stock discovery and trading tools.
Make Your Next Scan More Deliberate
The next step isn’t to chase the most dramatic ticker. Treat each candidate as a hypothesis: identify what could drive movement, define what would invalidate the setup, and decide whether the position fits your risk limits. That discipline keeps the process focused when headlines, gaps, and fast price action compete for attention.
Finding volatile stocks for swing trading becomes more useful when screening leads to a repeatable decision framework. Refine the signals that qualify a stock for review, and distinguish a watchlist candidate from an actual trade. A strong screen narrows your focus; it doesn’t make the decision for you. The value lies in applying consistent criteria and reviewing how well they align with your strategy.
If you want support discovering candidates and organizing your next research step, contact TickerAI to explore your options. Use the tools to bring structure to your process, then make each trading decision with care and confidence.
Frequently Asked Questions
What Makes a Stock Volatile?
A stock is volatile when its price changes noticeably and frequently over a given period. The movement may follow company news, earnings results, shifting expectations, or broader market trends. Distinguish sustained price movement from a temporary spike by reviewing the chart across different timeframes. A gap that quickly reverses, for example, behaves differently from a move that continues to form higher highs.
Why Swing Trade?
Swing trading seeks price moves that develop over multiple sessions rather than focusing only on intraday fluctuations. It may suit traders who analyze chart patterns and catalysts without building a strategy around opening and closing positions within one day. Holding overnight brings exposure to news and price gaps, so the planned holding period and exit conditions remain central to the decision.
How do professionals assess whether a stock is volatile enough for swing trading?
Compare the stock’s recent price range with the movement a proposed setup needs to justify its risk. Consider whether price has room to move between nearby chart levels and whether activity supports the direction. A stock can be highly volatile yet unsuitable if its swings are erratic or conflict with the setup’s exit level. Assess it relative to the trade plan, not against a universal cutoff.
How do professionals use ATR, beta, and average true range percentage to screen for volatile stocks?
ATR estimates a stock’s typical price range over a chosen period, while beta compares its movement with a broader market benchmark. Average true range percentage expresses ATR relative to the stock’s share price, helping compare movement across differently priced stocks. Read these measures together: elevated ATR may indicate wider swings, while beta and ATR percentage add market-relative and price-relative context.
Which news catalysts and earnings dates can cause stock volatility?
Earnings releases and company outlook updates can shift expectations and trigger rapid repricing. Product announcements, leadership changes, major contract news, or industry developments can also draw attention to a ticker. Track scheduled earnings and assess whether the subsequent price action supports the news. A catalyst can create a gap, but follow-through or rejection on the chart helps clarify how traders are responding.
How do I compare volatility and risk across stocks for swing trading?
Compare each stock’s ATR percentage, beta, trading activity, and distance to nearby chart levels rather than ranking candidates by price movement alone. Then consider the distance between the planned exit and entry, since it affects exposure for a given position size. A higher volatility reading can mean a wider range of possible outcomes, not a better opportunity. Consistent criteria make comparisons more meaningful.


