

A strong-looking chart can still belong to a company with weakening fundamentals. That’s why fundamental vs technical analysis for swing trading isn’t an either-or decision: fundamentals help qualify what may be worth watching, while technicals help assess when a setup may be forming.
If you’ve struggled to separate company research from chart analysis, or found yourself buried in indicators and financial metrics, the issue may be your process rather than a lack of data. Neither method can establish that a trade will succeed. Used together, though, they can help you decide what to investigate, when a setup may meet your criteria, and what would invalidate your thesis.
This guide compares what each approach can and can’t reveal, where each can mislead, and how to combine them in a repeatable swing-trading workflow. You’ll learn how to screen candidates with fundamental context, assess entries and exits with technical analysis, and review setups without treating any signal as a guarantee. AI-powered discovery can help surface candidates for your own review, but your trading plan and judgment remain central.
Key Takeaways
- In fundamental vs technical analysis for swing trading, fundamentals help qualify candidates while technicals help assess price behavior and timing.
- Review company context and upcoming events before using a chart to develop a trade hypothesis.
- When fundamental and technical signals conflict, treat the mismatch as context to investigate, not a reason to force a trade.
- Use a repeatable process: define your universe, review context, assess the chart, document your thesis, and monitor for changes.
- AI discovery, curated setups, watchlists, and alerts can surface candidates for your review without replacing judgment or a trading plan.
Fundamental vs. technical analysis for swing trading: what each method tells you
Fundamental analysis assesses a business and the conditions around it. Technical analysis examines how its price is behaving. In swing trading, both can help answer practical questions, but they draw on different evidence.
A swing trade aims to capture a price move over multiple trading sessions. The holding period varies with the setup, market conditions, and the trader’s plan; there’s no single standard duration. It helps to separate two tasks: fundamentals can show whether a company’s context deserves attention, while technicals help you assess whether price action supports a potential trade.
| Comparison | Fundamental analysis | Technical analysis |
|---|---|---|
| Inputs | Revenue, earnings, margins, debt, cash flow, business model, company and industry news | Price action, trend, support and resistance, volume, momentum indicators |
| Questions answered | How is the business performing? What risks or events could shape its outlook? | What is price doing? Is momentum building, stalling, or reversing? |
| Strengths | Adds business and event context to a price move | Helps assess possible entry areas, invalidation levels, and price behavior |
| Limitations | Strong company metrics don’t determine short-term price direction or timing | A chart doesn’t establish business quality or intrinsic value |
| Swing-trading role | Qualify and contextualize candidates | Evaluate timing and the trade’s price-based conditions |
What fundamental analysis examines in a swing-trading candidate
Review trends in revenue and earnings, margins, debt, and cash flow. Consider how the business model and competitive position may affect resilience. These factors add context to a short-term move: a rally alongside improving results has a different business backdrop from one occurring as margins narrow or debt concerns grow. Company filings and earnings reports are evidence to assess, not automatic buy or sell signals. A scheduled report can also introduce event risk.
What technical analysis examines before a potential entry
On the chart, assess the prevailing trend, recent price action, and areas where price has repeatedly found support or resistance. Volume can help show participation behind a move, while momentum indicators can help describe whether price strength is accelerating or fading. These tools organize observations, but no indicator confirms what will happen next. For a concise overview of the discipline and its tools, see technical analysis.
Price evidence describes how the market is trading; business-performance evidence describes how the company is operating. A chart can look constructive even when the company faces deteriorating fundamentals, and a healthy business can have a weak chart. In fundamental vs technical analysis for swing trading, each method informs a scenario, not a certain prediction. Even when both point in the same direction, market, company, and execution risks remain.
How fundamentals and technicals work together across a swing trade
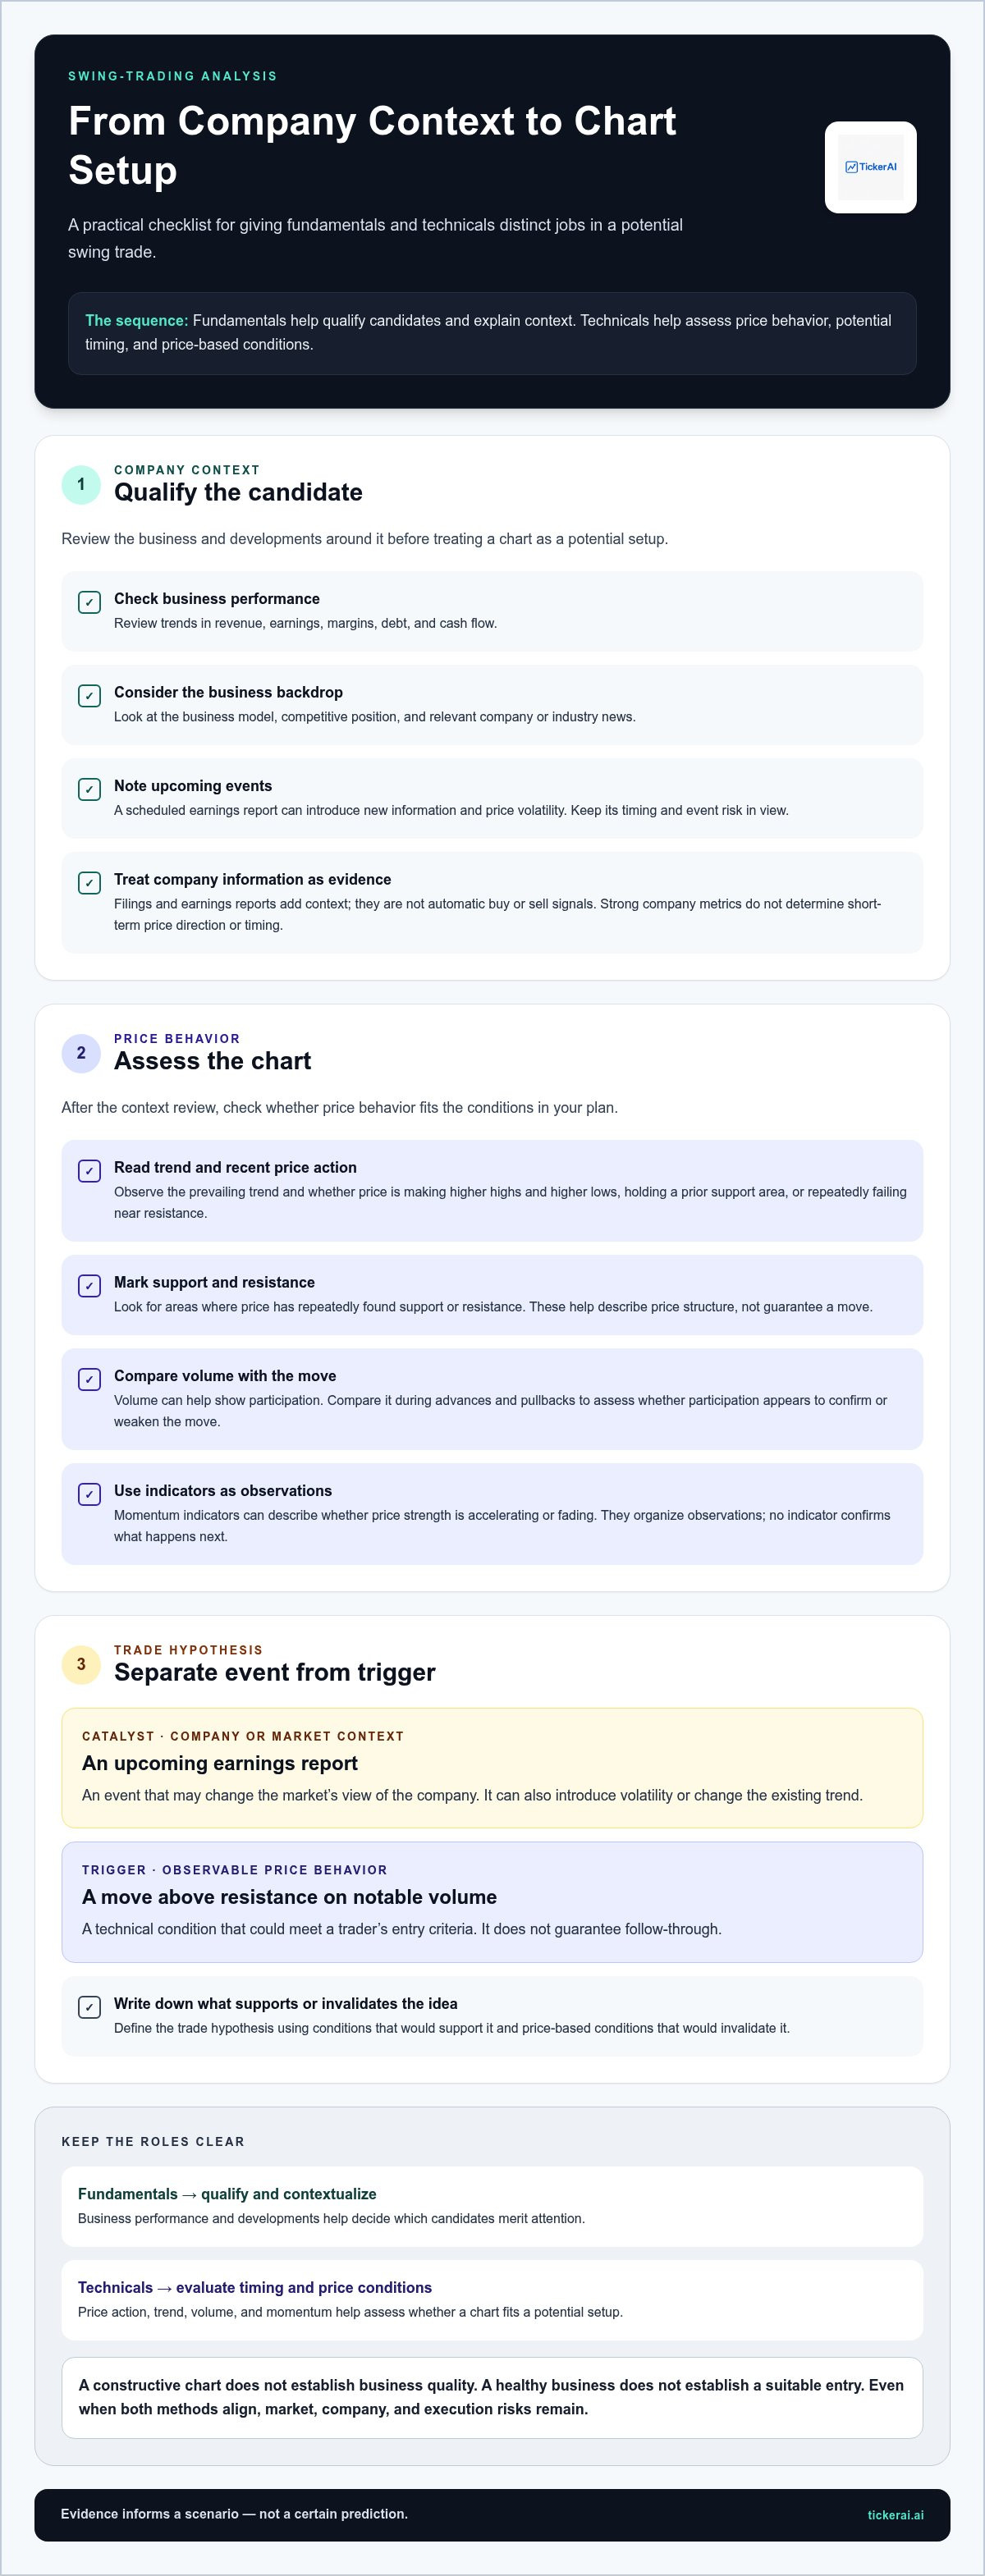
Put the two methods in sequence, not in competition. Start with the company and its current context. Qualify candidates based on business direction and relevant developments, then assess the chart for a setup. Define a trade hypothesis with conditions that would support or invalidate it. This sequence keeps strong company data from becoming an automatic entry signal and stops an attractive chart from standing in for business research.
Fundamentals help decide which candidates merit attention; technicals help assess whether price behavior presents a potential entry. The process works best when each method has a distinct job.
Use fundamentals to qualify candidates and understand catalysts
Review the direction of revenue, earnings, margins, debt, and cash flow, then consider company developments that could alter the outlook. Scheduled earnings matter because a report can introduce new information and price volatility. Improving results may provide constructive context, but company quality alone doesn’t tell you whether the current price is extended, consolidating, or setting up for a trade. Use filings and company updates to understand the situation, and keep event risk in view.
Separate the catalyst from the trigger. An upcoming earnings report is a catalyst, an event that may change the market’s view of the company. A move above resistance on notable volume may be a technical trigger, observable price behavior that could meet a trader’s entry criteria. Neither guarantees follow-through. A catalyst may create a gap or reverse an existing trend, so include its timing and related risk in your trade hypothesis.
Use technicals to assess trend, setup, and timing
Once a candidate passes the context review, inspect its price structure. Is it making higher highs and higher lows, holding a prior support area, or repeatedly failing near resistance? Compare volume during advances and pullbacks to see whether participation appears to confirm the move or weaken it. These observations help determine whether a chart is actionable under your rules, not whether the underlying company is valuable.
Moving averages can help summarize trend direction, and RSI can offer a view of momentum. They’re optional tools, not a checklist every trade must pass. Adding indicators without a defined question can create noise rather than clarity. Look for a setup that fits your plan, such as a breakout attempt or a pullback toward a level you’re monitoring. Then decide what price behavior would confirm or undermine the idea.
Keep confirmation separate from risk decisions. A technical signal may support a possible entry, but it doesn’t set your position size or decide how much loss you can tolerate. Those choices require your own rules, including how you’ll respond if the setup fails or an earnings announcement changes the context.
For candidate discovery before applying these checks, AI-powered swing trade setups can provide ideas to review. Treat surfaced candidates as research starting points; your analysis and trading plan remain essential.
Fundamental vs. technical signals: how to assess agreement and conflict
Signals don’t always line up. A company’s results may look constructive while its chart loses support, or price may strengthen as business conditions deteriorate. In fundamental vs technical analysis for swing trading, a mismatch isn’t a puzzle to solve by choosing a favorite method. It’s information to compare with your predefined criteria.
Neither approach is universally superior. Fundamentals help assess the company and its context; technicals describe price behavior and potential timing. Their usefulness depends on the decision you’re making and how your trading process handles uncertainty. Agreement can strengthen a thesis, but it can’t remove market, company, or execution risk.
When fundamental and technical evidence point in the same direction
Hypothetical example: A company reports improving revenue and margins, while its share price holds a defined support area and then moves above resistance with increased volume. Together, these observations may support a coherent thesis: business conditions appear constructive, and price action may meet a technical setup. This is alignment, not a forecast. You still need independent risk controls, clear invalidation criteria, and ongoing review.
When the chart and company story disagree
A constructive company story paired with a weakening chart may mean the timing is poor, or that the market is responding to information your initial review missed. Don’t treat good results as a reason to ignore lower lows, failed rebounds, or a breakdown below a level in your plan. Reassess the chart and the context before deciding whether the candidate still qualifies.
The opposite conflict matters, too. A chart can strengthen even as earnings, margins, or other business conditions deteriorate. The price move may have a different driver, but technical strength alone doesn’t resolve concerns about the company. Investigate what changed and whether the original thesis still holds rather than assuming momentum makes the context irrelevant.
Use a neutral decision framework:
- Wait: Evidence is incomplete, a key event is near, or the chart hasn’t met your entry conditions. Set a specific condition that would prompt another review.
- Monitor: The candidate remains relevant, but one method hasn’t confirmed the thesis. Track the unresolved signal, such as whether price can reclaim a level or business concerns ease.
- Reject: A predefined fundamental or technical criterion has failed. Remove the setup instead of changing the rules to justify it.
This framework makes disagreement actionable without forcing a trade. Record which evidence conflicts, what would change your assessment, and when you’ll review it. If neither method supports the setup under your rules, passing is a valid outcome. If signals later align, assess the opportunity using the evidence then available, not a desire to recover a missed move.
A repeatable swing-trading workflow for combining both analysis methods
A useful process narrows the field at each stage and produces a clear decision rather than an expanding research queue. In fundamental vs technical analysis for swing trading, screening, setup assessment, and execution rules are separate decisions. Each needs its own evidence and criteria.
- Define the universe. Set boundaries for the stocks you’ll review, such as the markets or sectors you follow and any liquidity or company criteria in your plan. The output is a manageable candidate list, not a commitment to trade.
- Review context. Check the company’s financial direction, relevant business or sector developments, and scheduled catalysts such as earnings. Record the key factor supporting your interest and any concern that could change your view. Then qualify the candidate for chart review, monitor it for a specific update, or remove it.
- Assess the chart. Check the trend, recent price structure, volume, and levels relevant to your setup. Compare what you see with the company context and any upcoming catalyst. A chart alert is a prompt to review, not an entry instruction. Decide whether price behavior meets your stated setup conditions.
- Document a thesis. Write down why the candidate is on your list, what chart behavior would support the idea, and what would invalidate it. Define your decision before acting, including any risk rules you’ll apply. A structured trading plan can help keep those rules distinct from the analysis itself.
- Monitor and review. Watch for changes in price, company context, or catalysts that could affect the thesis. When the setup no longer meets your criteria, update its status or stand aside. Don’t keep a candidate active simply because you’ve already researched it.
Move from candidate discovery to a chart-based setup
Start with a focused list and enough company or sector context to know why each name is being watched. Then test one chart-based hypothesis at a time. For example, if the thesis depends on price holding a support area, note that condition and what would count as a failure under your rules. Check volume and nearby resistance, and account for a potential catalyst. An alert can flag a change, but verify the setup and its invalidation condition before treating it as actionable.
Keep the process measurable without overstating precision
For each candidate, record the original thesis, the observed setup, your decision, and what happened later. Consistent notes make it easier to review whether you followed your process, where your criteria were unclear, and which observations deserve further testing. A journal can support that recordkeeping; define risk rules separately. Reviewing past decisions can improve process discipline, but it doesn’t establish that similar setups will produce similar future results.
AI stock opportunity discovery can streamline the discovery stage by surfacing candidates for your own review. Watchlists and alerts can help you monitor names; your criteria and judgment determine what happens next.
Where AI stock discovery fits in a fundamentals-and-technicals process
AI stock discovery can reduce the time spent searching a broad market for names to investigate. Its role is to surface and organize candidates, not decide which trade you should take. Treat an AI-generated idea as the start of your review: it gives you a candidate to check against company context, chart evidence, and your own trading rules.
What automated discovery can contribute to swing-trade research
TickerAI’s curated swing trade setups can bring potential candidates into view, while smart watchlists and real-time alerts support ongoing monitoring. These features can help you notice an idea or a change worth reviewing without treating it as a complete thesis. Next, assess the company information behind the candidate, inspect its chart, and decide whether the setup fits your criteria.
Keep the handoff from discovery to analysis clear:
- Candidate surfaced: Identify what made the stock relevant to your watchlist or review queue.
- Context checked: Examine company developments and any event that could change your view.
- Chart reviewed: Compare current price behavior with the setup you’re considering.
This sequence makes discovery useful without turning every alert into a trade. If an idea doesn’t pass your checks, leave it on watch or move on.
Turn a surfaced idea into an independent decision
Before acting on a candidate, assess whether its context supports further attention, whether the technical evidence meets your setup conditions, and whether the idea fits your own risk parameters. Write down what would invalidate the thesis. If a new alert arrives, use it as a prompt to reassess the evidence, not as an instruction to enter or exit.
Discovery tools can’t guarantee signal quality or trading outcomes. Alerts are research inputs. They don’t execute trades or provide personal financial advice, and they don’t replace a defined plan or your judgment. A surfaced idea may be incomplete, outdated, or unsuitable for your approach. Confirm the relevant information and make the decision independently.
Used this way, automation can support a disciplined routine: it helps identify candidates to investigate and monitor, while you retain control of the analysis and decision. Explore TickerAI’s AI-powered stock opportunity discovery as one way to bring potential candidates into your research process.
Make your next setup a test of your process
Put the framework to work on one candidate at a time. Before acting, write down what you’re testing, what evidence would change your view, and what you’ll learn whether you take the trade or pass. Over time, review whether your decisions followed your criteria. That record can reveal where your process needs refinement without treating any single outcome as proof that a method works.
The value of fundamental vs technical analysis for swing trading lies in making decisions more deliberate, not certain. Keep your research focused, stay open to conflicting evidence, and let your predefined rules guide the next step. AI discovery can help bring potential opportunities into view while leaving analysis and judgment with you.
To find candidates for your own review, explore TickerAI’s AI-powered stock opportunity discovery. Use the ideas alongside your own research, criteria, and trading plan.
Frequently Asked Questions
Is fundamental or technical analysis better for swing trading?
Neither is universally better. The choice depends on the decision you need to make, your process, and your intended holding period. Company research may help you identify a business facing a material setback, while chart analysis can help you assess whether a potential setup fits your entry criteria. Both methods have limits, and neither can guarantee a profitable trade.
Can you use fundamental analysis for swing trading?
Yes. A swing trader can use financial results, company developments, sector conditions, and scheduled events to decide which stocks merit attention. If a company’s outlook changes before an earnings report, for example, that context may affect whether you keep it on a watchlist. Fundamental research alone doesn’t identify an ideal entry point or predict the next price move, so assess price behavior separately before making a decision.
How do you combine fundamental and technical analysis for swing trading?
First define the stocks and conditions that fit your approach. Then review relevant company developments and upcoming events, and assess the chart for a setup that meets your criteria. Before deciding, record what supports the idea and what would invalidate it. This is a research sequence, not a formula that fits every trader. Set your own risk limits, and don’t treat agreement between methods as certainty.
Do swing traders need to read financial statements?
Not every swing trader needs to perform an exhaustive financial-statement review for every stock. A focused check of relevant items, such as recent earnings direction, debt concerns, or changes in cash flow, may reveal context that isn’t visible on a chart. Match the depth of research to your strategy and holding period. Statements are one input; they don’t replace evaluating price behavior, setup conditions, and risk.
Can technical analysis work without fundamental analysis?
Yes. A trader can build a technical-only process around price, volume, trend, and clearly defined setup criteria. The trade-off is that chart signals may not explain a company announcement, changing outlook, or scheduled event that could affect price. If you use charts alone, apply your criteria consistently and decide how you’ll handle company-specific news. A technical setup still doesn’t establish business quality or ensure a trade will work.
Do fundamentals affect a stock’s short-term price?
Yes. Earnings, guidance, disclosures, and other company developments can influence how market participants value a stock. The reaction isn’t predictable with certainty: expectations may already be reflected in the price, or the market may interpret new information differently than expected. For a swing trader, fundamental context can flag a potential catalyst or reason for caution, while the chart shows the price response so far.
Can AI replace fundamental or technical analysis for swing trading?
No. AI can scan markets, organize information, and surface candidates, but an alert still needs independent review against company context, chart evidence, and your risk limits. TickerAI supports stock discovery through AI-generated swing trade setups and long-term investment ideas, smart watchlists, and real-time alerts. It doesn’t provide personalized financial advice or brokerage execution. Treat surfaced ideas as research inputs, not trade instructions or guarantees of an outcome.


