

A faster market scan isn’t the same as better stock analysis. To understand how to automate stock analysis, connect market screening with technical and fundamental signals, then review the resulting ideas on charts. A consistent workflow makes these steps repeatable while leaving the final investment decision to you.
It’s easy to get buried in tickers, indicators, company data, and charts when looking for actionable ideas. Automation can reduce the noise, but its value depends on how well your screening criteria and analysis work together. This article explains how to structure market scans, automate technical and fundamental analysis, and review chart signals to generate and assess stock ideas more clearly.
Key Takeaways
- Use market scans to narrow a broad universe of stocks into a focused set of ideas for review.
- Combine technical signals with fundamental criteria to assess candidates from more than one angle.
- Review chart structure and price action before deciding whether a signal merits further attention.
- Consider AI Stock Opportunity Discovery when you want curated stock ideas, swing trade setups, watchlists, alerts, or long-term investment ideas.
Market scanning and real-time idea generation
Start by narrowing the market universe with a repeatable scan, then add relevant data feeds, news, and AI-assisted research. A defined process helps distinguish fresh candidates from routine price movements.
-
Define a focused scan universe
Set the scan’s purpose first: intraday monitoring, swing trades, or long-term research. Begin with 10-15 tickers, then filter for criteria such as trading volume, price movement, or sector. A smaller universe makes alerts easier to interpret and lets analysts compare candidates against consistent conditions. Expand the list only when the scan produces useful ideas across different market conditions.
-
Understand Broker and Market-Data API Requirements
Before connecting a broker API or market-data feed, map each required data field to its source. Assess authentication, data permissions, coverage, timestamps, rate limits, latency, and outage handling. Distinguish feeds used for analysis from broker connections that can route trades. In the United States, automated analysis alone does not determine which trading rules apply; requirements can depend on account type and trading activity. Broker terms and applicable account requirements matter when automation moves from research to order execution.
-
How Professionals Monitor News and Market Sentiment
Pair price alerts with a monitored news feed, then classify each event by ticker, topic, and timing. Company announcements, earnings coverage, and analyst commentary can explain why a scan flagged a stock. Separate a headline’s tone from its likely relevance: positive wording may not change the underlying business outlook. Compare the event with price and volume behavior before treating sentiment as a signal. Keep a timestamped event log to distinguish new information from repeated coverage.
-
How Professionals Use AI-Assisted Market Research
Use AI-assisted research to group related signals and surface candidates for human review. A system can organize company updates, summarize recurring themes, and rank stocks against defined screening criteria. Treat these results as idea-generation, not conclusions. Review the underlying evidence, compare it with historical behavior, and use backtesting to assess whether a signal has been useful. For example, a cluster of sector news can prompt a focused review of affected tickers, rather than an immediate trade.
Automating technical and fundamental analysis
When deciding how to automate stock analysis, define which signals inform research and which require human review. Keep analysis, validation, and order execution as separate stages.
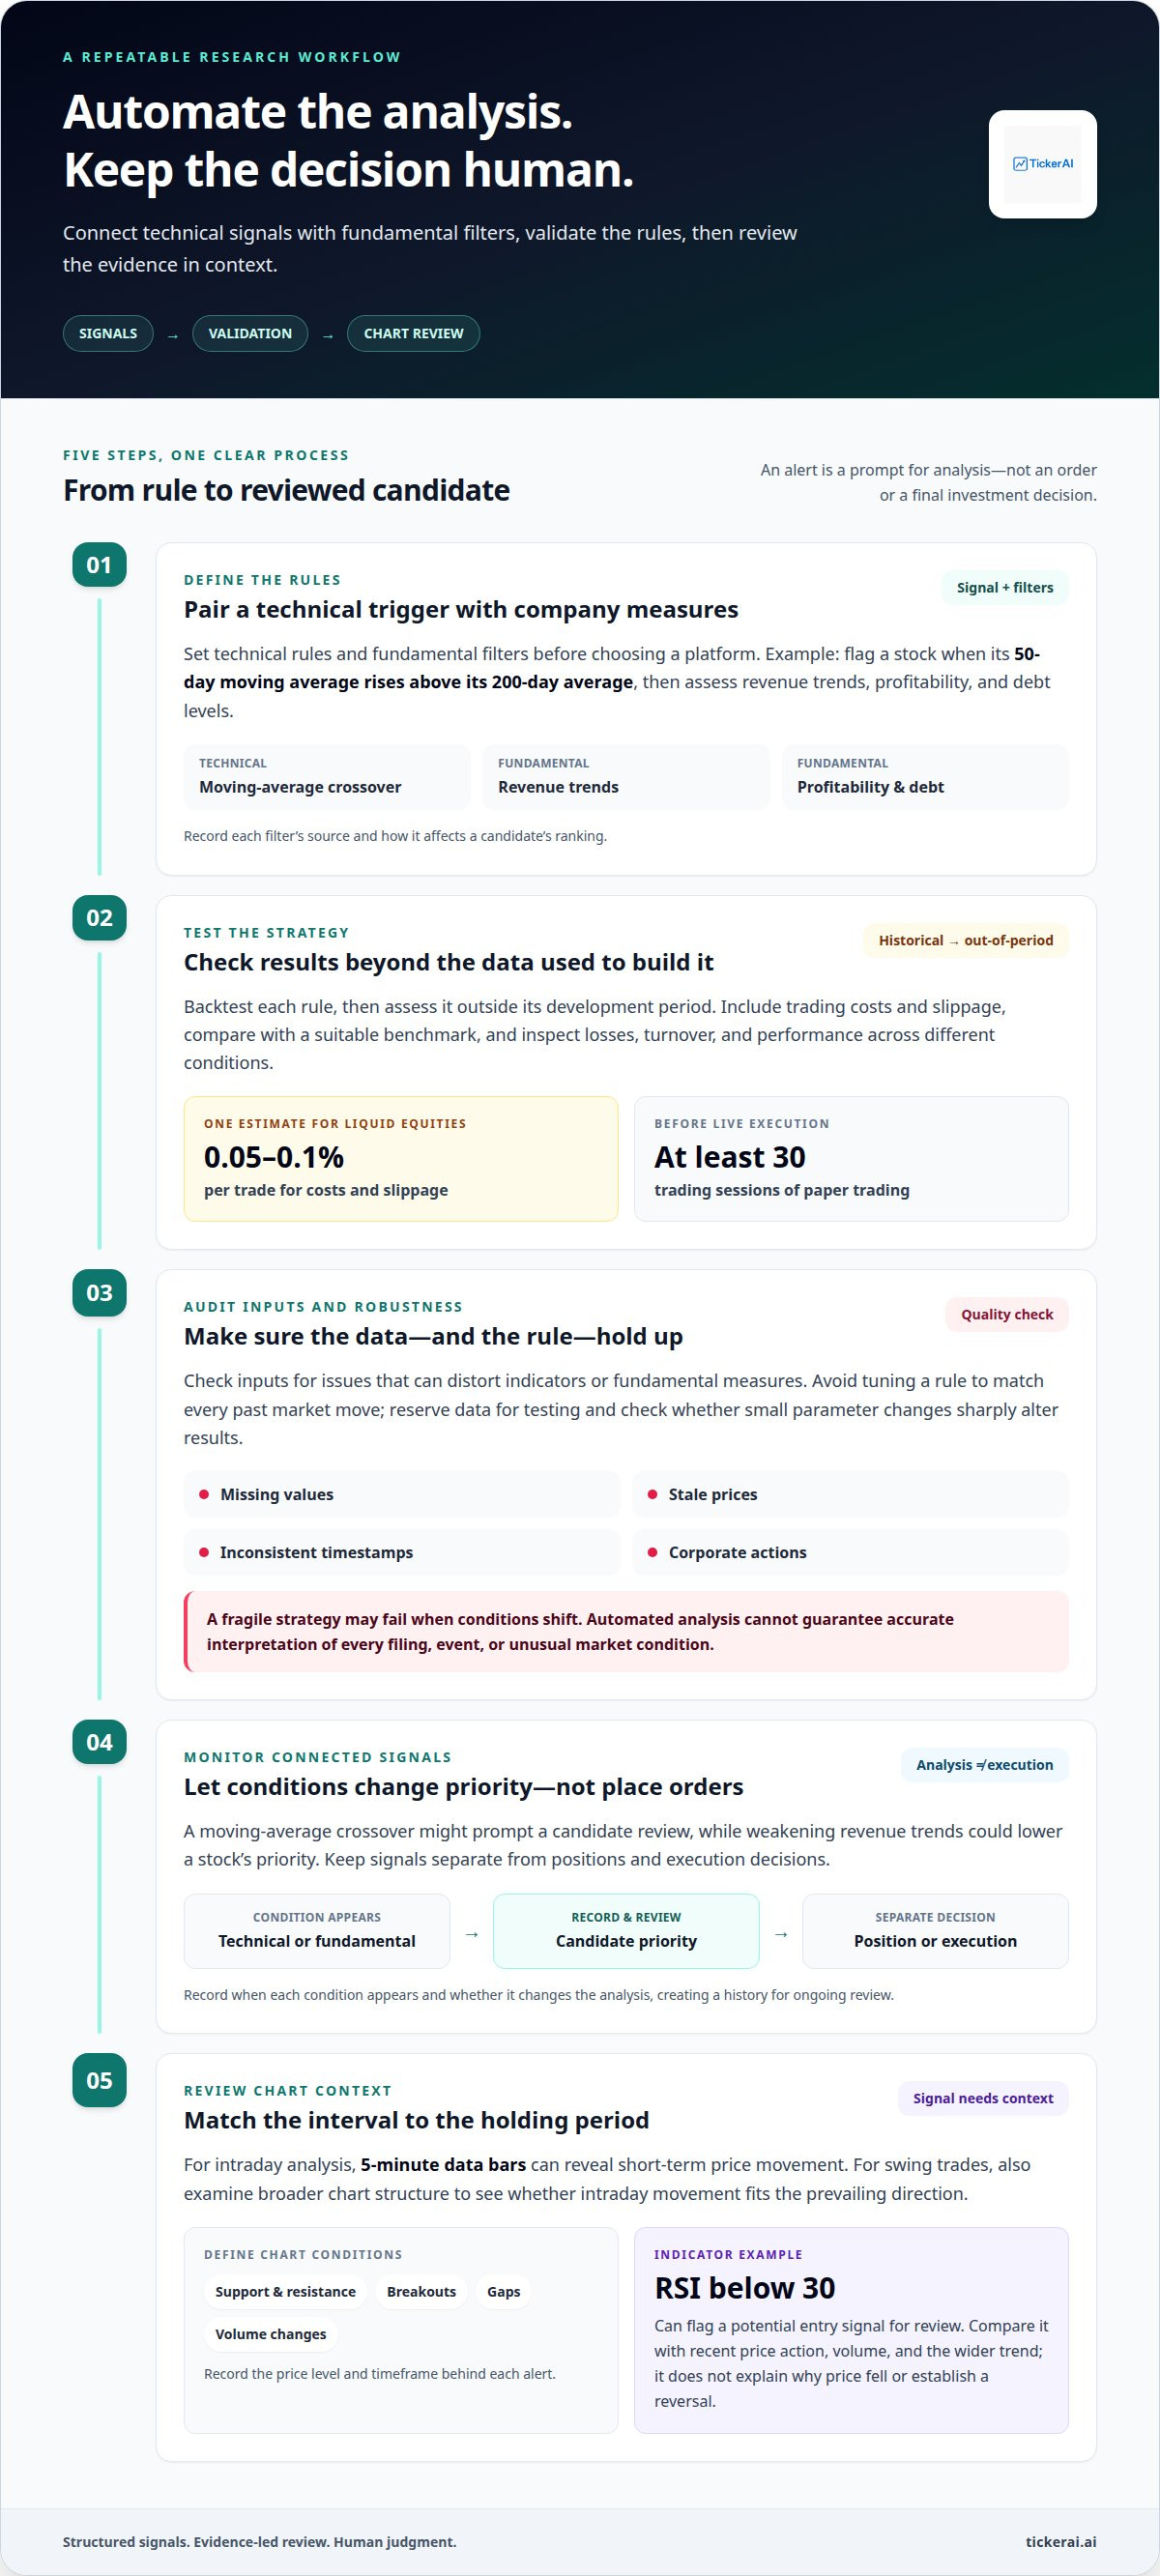
- Set technical rules and fundamental filters before choosing a platform. For example, a rule can flag a stock when its 50-day moving average rises above its 200-day average. Pair that signal with measures such as revenue trends, profitability, and debt levels. This helps distinguish a price crossover from a company that also meets the analysis criteria. Record each filter’s source and how it affects a candidate’s ranking.
-
How Professionals Backtest and Validate Automated Stock Analysis
Test each rule against historical data, then assess results outside the period used to develop it. Include trading costs and slippage; one backtesting estimate for liquid equities is 0.05-0.1% per trade. Compare the strategy with a suitable benchmark and inspect losses, turnover, and performance across different conditions. Before live execution, professionals can use paper trading for at least 30 trading sessions.
Validation means checking whether a rule performs consistently beyond the data used to develop it, not merely whether it fits past prices.
-
Understand Data Quality and Overfitting Risks in Automated Stock Analysis
Check inputs for missing values, stale prices, inconsistent timestamps, and corporate actions that can distort historical comparisons. Poor data can produce misleading indicators or fundamental measures. To reduce overfitting, don’t tune rules to match every past market move. Reserve some data for testing, and check whether small parameter changes sharply alter results. A fragile strategy may fail when conditions shift.
Automated analysis cannot guarantee accurate interpretation of every filing, event, or unusual market condition.
- Connect technical and fundamental outputs with clear monitoring rules. A moving-average crossover might prompt a candidate review, while weakening revenue trends could lower a stock’s priority. When deciding how to automate stock analysis, keep signals separate from positions and execution decisions: an alert is not an order. Record when each condition appears and whether it changes the analysis, creating a history for ongoing review.
Studying charts, price action, and trends
Chart automation turns price history into structured signals, but each signal needs context. A sound workflow defines what a chart pattern means before it prompts action.
- Set the chart interval to match the strategy’s holding period. For intraday analysis, 5-minute data bars can reveal short-term price movement without mixing it with longer-term trends. A practical plan for how to automate stock analysis starts by aligning the interval with the intended review. For swing trades, analysts also examine broader chart structure to see whether intraday movement fits the prevailing direction.
- Translate price action into explicit conditions rather than relying on vague pattern labels. A chart-review process can identify support and resistance zones, breakouts, gaps, and changes in trading volume. Record the price level and timeframe behind each alert. This context helps distinguish a sustained move through resistance from a brief spike that quickly reverses.
- Use indicators as supporting evidence, not standalone instructions. For example, an RSI below 30 can flag a potential entry signal for review, but it doesn’t establish why the price fell or whether conditions support a reversal. Analysts compare the RSI reading with recent price action, volume, and the wider trend. The signal’s meaning depends on that combined context.
- Review chart output before treating an alert as actionable. When deciding how to automate stock analysis, define a custom rule that flags a breakout only when price clears resistance and volume confirms the move. Then check for conflicting signals, such as a breakout against a weakening trend. Log the chart condition, timestamp, and review outcome to assess whether the signals remain useful as market behavior changes.
What tools, platforms, and programming languages are used to provide automated stock analysis?
Choose tools by function, not feature count. A workable setup connects market data, analysis logic, and a clear review interface.
- Match each workflow stage to a tool. A market-data platform supplies prices and company information, while a broker API may connect analysis to order functions. Keep these roles distinct: a signal-generation system can flag a candidate without initiating a trade. Document which inputs feed each screen, how often data refreshes, and what happens if a feed becomes unavailable.
- Choose a programming language that suits the analysis and the team maintaining it. Python is commonly used for data processing, statistical analysis, and model workflows. SQL can query structured financial records, while spreadsheets support quick review of screening results. For example, a Python process might calculate a moving average and store the result for review in a dashboard.
- Assess how a platform handles data before building dependent logic. Confirm that it can align price history, fundamentals, and timestamps consistently. A charting interface helps analysts inspect price patterns, while a database can retain historical observations for comparison. Define how the workflow records missing fields, delayed updates, and revised company data. These controls make outputs easier to interpret.
- Separate research tools from trading controls, and decide where human review occurs. An automated process might rank stocks, show the factors behind each result, and send an alert for evaluation. If broker connectivity is involved, confirm the supported data permissions, authentication, and order capabilities. Don’t treat a platform label such as “AI” as proof of analytical quality. Review the method, inputs, and traceability of its outputs.
If you want curated ideas alongside your own research workflow, explore AI stock opportunity discovery.
TickerAI: AI Stock Opportunity Discovery
TickerAI’s AI Stock Opportunity Discovery helps investors find a structured stream of stock ideas to evaluate. Use it when you want support finding candidates instead of building every scan and research workflow from scratch.
TickerAI’s Swing Trade Setups surface short-term opportunities, while its Long-Term Investment Ideas focus on a different investing horizon. Smart Watchlist & Alerts help you follow selected stocks and market movements. Use these offerings as inputs to your research: review the reasoning behind each idea, consider how it fits your criteria, and make your own investment decisions.
Explore how TickerAI can support your stock research by contacting TickerAI.
Put Your Analysis Workflow Into Motion
Decide which part of your research process needs more structure. Start with the decisions you make repeatedly, then define the information each one requires. This keeps automation focused on useful signals instead of adding more alerts to an already crowded screen.
As you consider how to automate stock analysis, keep research separate from investment decisions. Automated outputs can organize candidates and focus your attention, while you assess whether each idea fits your criteria and risk tolerance. A workflow should clarify your process, not replace your judgment.
If you’re ready to explore support for your stock research, contact TickerAI about your analysis workflow. Take the next step with a clearer process and a focused view of the opportunities you want to evaluate.
Frequently Asked Questions
What parts of stock analysis can be automated?
Automation can handle data collection, screening, indicator calculations, event alerts, and recurring reports. It can also flag unusual volume or changes around earnings dates to help prioritize review. It works best for repeatable tasks with clear inputs and rules. It cannot determine whether a company’s strategy, management, or valuation fits an individual investor’s goals. Those judgments still require context.
What data sources and APIs do providers use for automated stock analysis?
Providers typically combine market-data feeds with company filings, earnings materials, and news sources. APIs move selected information into analysis systems; broker APIs may expose account or order-related functions, depending on permissions. Before integration, a provider maps ticker identifiers across sources and establishes how data fields correspond. Analysis depends on consistent definitions, coverage, and update handling, not simply the number of connected feeds.
How does a provider build an automated stock screening workflow?
A screening workflow starts by translating a research objective into rules, such as filtering for companies with positive free cash flow in a chosen sector. Each rule is matched to a data field, applied to the selected stock universe, and used to produce a shortlist with reasons for inclusion. Review false positives, refine the criteria, and track rule changes alongside output quality.
Which financial ratios and fundamental metrics can a provider track in automated stock analysis?
Common metrics include price-to-earnings, price-to-sales, gross margin, operating margin, debt-to-equity, return on equity, and free cash flow. These measures can be calculated and compared across companies or reporting periods. Interpretation requires context: accounting methods, business models, and sector economics affect comparability. For example, debt levels can have different implications for a capital-intensive utility and a software company.
How do providers automate technical indicators and price data for stock analysis?
Apply defined calculations to time-stamped price and volume data. A moving average tracks a rolling average price, while RSI expresses recent momentum through the relationship between recent gains and losses. Specify whether values update during a price bar or after it closes. Handle missing observations and associate each output with its ticker and calculation time.
What U.S. regulations or broker rules apply to automated stock analysis and trading?
Automated analysis alone does not determine which U.S. trading rules apply; requirements can depend on account type and trading activity, and broker terms matter when automation routes orders. Pattern day trader rules require $25,000 in margin accounts making more than 3 day trades in a rolling 5-day period.


