

A stock screener for beginners can narrow a broad market to companies that match selected criteria, but results are only as timely as the underlying data. Screening databases update on different schedules, so check data freshness as well as your filters. A match is a starting point for research, not a verdict on a company.
It’s easy to focus on familiar metrics such as valuation or company size without understanding what each filter measures or how current its data is. This guide explains how screeners work, compares common filter choices, and shows how to assess data freshness. You’ll also learn how to turn screening results into a research shortlist while keeping quantitative signals in perspective alongside qualitative factors.
Key Takeaways
- Compare screening services by the features they provide, not just whether they’re free or paid.
- Choose filters that match the company traits you want to investigate, then interpret each metric in context.
- Use screening results to build a research shortlist, and consider qualitative factors that numerical filters may miss.
- Assess data freshness before relying on a result, since different databases update on different schedules.
What is a stock screener?
A stock screener combines a company database, selectable variables, and a screening engine. Set criteria such as sector, market capitalization, revenue, or trading volume, and it returns companies that match. A stock screener for beginners is most useful when its filters are understandable and its results can be checked against current data.
Start by matching the service to your research task. A company-focused search may call for valuation and financial filters, while an options search needs contract-level criteria. Free and premium plans can differ in data freshness, charting, alerts, and available filters. Free versions may include ads; paid subscriptions may add features such as charts, real-time quotes, and email alerts.
Screeners mainly process quantitative inputs, so they can miss qualitative issues such as pending lawsuits, labor problems, or customer satisfaction. A company that passes your filters is a research lead, not a complete assessment.
U.S. brokerages may offer stock screeners, but access requirements vary. Some tools require an account login, while others are available without one. Compare access requirements alongside the filters and data features.
When using Barchart options screening, consider whether its available criteria fit your analysis. Options volume, expiration, strike price, and implied volatility can help narrow contracts. Check how clearly the service displays data timing and whether its results support your next research step. An options-focused screen does not answer broader questions about the underlying company.
| Option | Filters | Data and access | Useful for |
|---|---|---|---|
| Free screener | Core company metrics | May include ads; check update timing | Initial exploration |
| Premium screener | May offer expanded criteria | May include real-time quotes or alerts | More frequent monitoring |
| Brokerage screener | Varies by brokerage | Account access may apply | Research within a brokerage platform |
| Barchart options screening | Assess contract-level criteria | Review displayed data timing | Options-focused filtering |
Choose a service whose filters, data timing, and access fit the companies or contracts you want to research.
Researching companies after screening
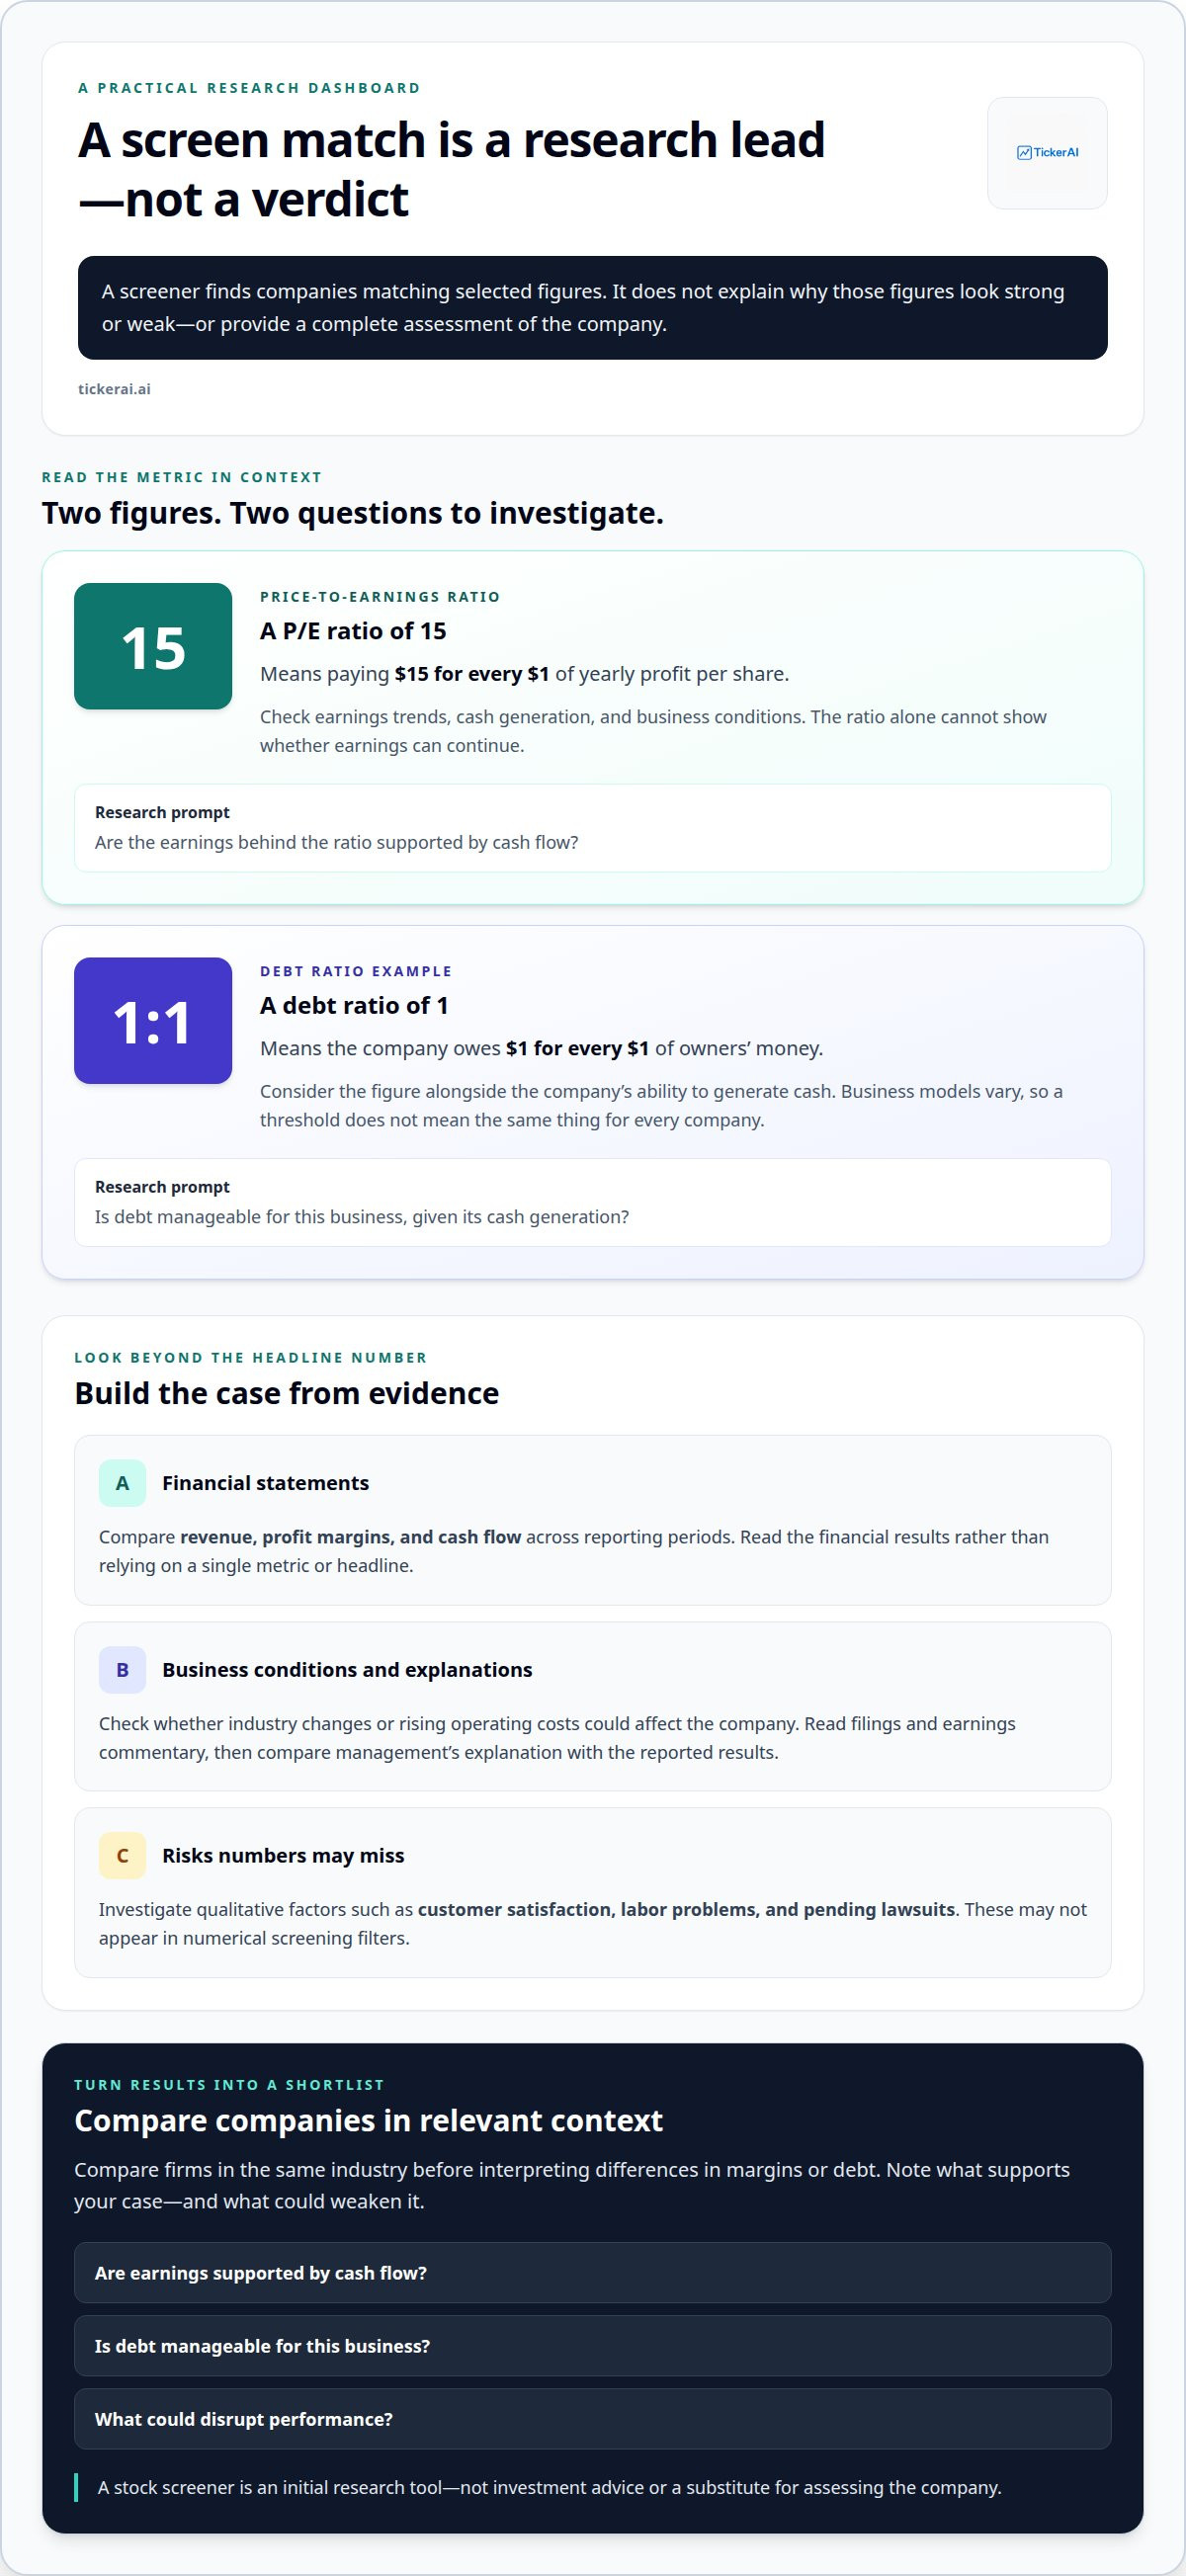
A screener identifies companies that match selected figures; it doesn’t explain why those figures look strong or weak. Treat each result as an initial research lead. Review the company’s business, financial statements, and risks before deciding whether it merits further attention. A screen is neither investment advice nor a complete assessment of a company.
Start with the metric that caused a company to appear. If a low price-to-earnings ratio caught your attention, compare earnings trends, cash generation, and the company’s business conditions. A P/E ratio of 15 means paying $15 for every $1 of yearly profit per share. That ratio alone doesn’t show whether earnings can continue.
- Read financial statements: Compare revenue, profit margins, and cash flow across reporting periods.
- Assess debt: A debt ratio of 1 means a company owes $1 for every $1 of owners’ money. Consider this alongside its ability to generate cash.
- Review business risks: Look for qualitative factors, such as customer satisfaction, labor problems, or pending lawsuits, that numerical filters may not capture.
Next, test whether the screen’s assumptions fit the company. A company may meet an earnings-growth filter while facing industry changes or rising operating costs. Read its filings and earnings commentary to understand what drove the numbers. Compare management’s explanation with the financial results instead of relying on a single headline metric.
Then compare screened companies in a relevant context. For example, assess firms in the same industry before interpreting differences in margins or debt. Business models vary, so a threshold won’t mean the same thing for every company. Note what supports your case and what could weaken it.
Finally, focus your shortlist on questions further research can answer: Are earnings supported by cash flow? Is debt manageable for the business? What could disrupt performance? A stock screener is an initial research tool, not a substitute for the analysis needed to assess potential investments.
Understanding filters and screening criteria
Stock filters turn a research goal into measurable conditions, then narrow the universe of companies. The right criteria depend on what you want the screen to find.
Quantitative Screening Criteria
Quantitative criteria compare measurable company or market data, including market capitalization, P/E ratio, revenue, volatility, profit margins, and debt-to-equity ratio. These filters differ from qualitative research because they produce rule-based matches rather than evaluating management, customers, or business risks. For example, an index-membership filter can narrow results to companies in a chosen market index. TickerAI describes a typical definition as companies with a market capitalization of less than $250 or $300 million.
Custom Stock Scanner Criteria
Custom criteria combine filters to focus results on a specific research question. For example, a screen might pair an industry selection with revenue or profit-margin conditions, then add a debt-to-equity threshold. Each added condition reduces the matches, so overly narrow settings can exclude companies worth examining. Keep criteria tied to your goal, and distinguish essential conditions from preferences.
Choosing Screening Criteria with a Professional
A screening process can translate a research goal and risk tolerance into relevant criteria. A search focused on established businesses may emphasize company size and profitability, while one focused on volatility may prioritize price movement. These approaches emphasize different signals, but neither proves a company is suitable. Clear priorities help align the screen with your research purpose.
Financial Terms and Metrics
Before screening, understand what each metric measures. Market capitalization represents a company’s total market value; the P/E ratio compares share price with earnings per share. Debt-to-equity compares company debt with shareholder equity, while revenue tracks sales and profit margin shows how much revenue remains as profit. These definitions help you interpret results, but no single metric explains a company’s full financial position. Check how the screener defines each field, then compare like metrics across companies.
Stock screening for beginners: what to expect from a professional service
A sound screening process starts with the reason for the search, then applies relevant criteria to narrow the candidates. The result is a focused research shortlist, not an automatic investment decision.
Professional Stock Screening for Beginners
Shape your screening approach around your goals and risk tolerance. For example, a search focused on long-term growth may prioritize earnings trends, while one focused on volatility may emphasize price movement. Unlike a generic screen, this approach ties filters to the purpose of your search. Treat matches as candidates for further research, not guaranteed outcomes.
Common Problems with Beginner Stock Screening Services
Beginners can mistake a match for a recommendation. A company that passes a P/E filter may still have weak cash flow, rising debt, or business risks. Another common mistake is stacking too many filters, which can exclude relevant companies before research begins. In both cases, criteria are treated as conclusions rather than tools for focusing attention.
Data freshness matters too. Stock screener databases update on different schedules, so consider whether the information is timely for your research question. Results based on older data may not reflect current conditions. Beginners can also overlook qualitative issues, such as customer satisfaction or pending lawsuits, because these may not appear as screenable metrics.
When evaluating screening support, look for a clear explanation of how its filters serve your research goal. The process should make each criterion understandable and distinguish filtered results from deeper analysis. Consider what types of signals shape the shortlist, how data timing is handled, and what the screen cannot evaluate. Clear boundaries make results easier to interpret.
The key takeaway: choose screening support that links its filters to a defined purpose and treats results as a starting point. A stock screen can organize market information, but further company research remains essential.
TickerAI: AI Stock Opportunity Discovery
TickerAI offers AI Stock Opportunity Discovery for readers who want an additional way to identify companies and market movements for further research. It can complement a screening process by bringing potential opportunities into focus, while company analysis remains essential before making investment decisions.
For different research horizons, TickerAI also offers Swing Trade Setups and Long-Term Investment Ideas. Smart Watchlist & Alerts can help you track selected market opportunities. These offerings suit readers looking for curated ideas and monitoring support alongside their own research, rather than brokerage execution or personal financial advice.
Explore TickerAI’s offerings or contact TickerAI to learn more.
Make your next research step deliberate
Build a repeatable process around the decisions you want to make. Before reviewing another company, write down what would strengthen your interest and what would change your view. This simple discipline can help you focus on evidence instead of market noise.
A stock screener for beginners is most valuable as part of an evolving research habit, not a one-time shortcut. Revisit your assumptions as you learn more about a company, and distinguish an interesting signal from a decision to invest. The goal isn’t to collect more tickers, but to make each research step purposeful.
If you want AI-powered opportunity discovery to support your research workflow, contact TickerAI to discuss your screening needs. Take the next step with a clear question and a focused approach.
Frequently Asked Questions
How fresh is the data behind each filter?
Data freshness varies by field and screening service. A quote may update on a different schedule from company financials or calculated ratios. Look for a timestamp or data-delay label beside the result, then decide whether the timing suits your research. For example, a longer-term company review may rely on financial data updated less frequently than market-price information.
Which filters should a professional use to screen stocks for me?
The filter set should reflect your research objective and risk tolerance, rather than applying the same formula to every search. A long-term company review might emphasize revenue, profitability, and debt, while a search for active market movement could prioritize volume and volatility. The professional should explain why each filter matters and how the resulting shortlist supports further research, not treat matches as personalized investment advice.
What is a stock screener and how does it work?
A stock screener searches a database of companies using selected conditions, then displays the entries that meet them. For example, you can combine an industry selection with a revenue condition to narrow a broad list. Results depend on the database fields and their update schedules. Use them to organize research, then investigate company-specific factors the selected conditions don’t capture.
What are the best free stock screening services for beginners in the U.S.?
There isn’t one best free service for every beginner. The right fit depends on the securities you want to screen, available filters, data timing, and whether the interface makes results easy to interpret. Compare a service’s company metrics with your research goal. A free option can help you explore basic criteria, but gaps in data or functionality may limit its usefulness for your workflow.
How do stock screening services compare by price, features, and data delay?
Compare services by plan structure, available filters, supporting tools, and the timing shown for each data type. Free access may include fewer features or ads; paid subscriptions may add tools such as charts, quotes, or alerts. Don’t assume a paid plan makes every field current in real time. Match the stated data timing to how quickly your research question depends on market changes.
Which basic screening criteria should a professional use, such as market cap, P/E ratio, and dividend yield?
Start with criteria that answer the client’s research question. Market capitalization can group companies by size, while P/E compares share price with earnings per share. Dividend yield can help identify dividend-paying stocks for closer examination. These measures serve different purposes, so a professional should select and interpret them in context rather than combine them into a universal pass-or-fail rule.


