

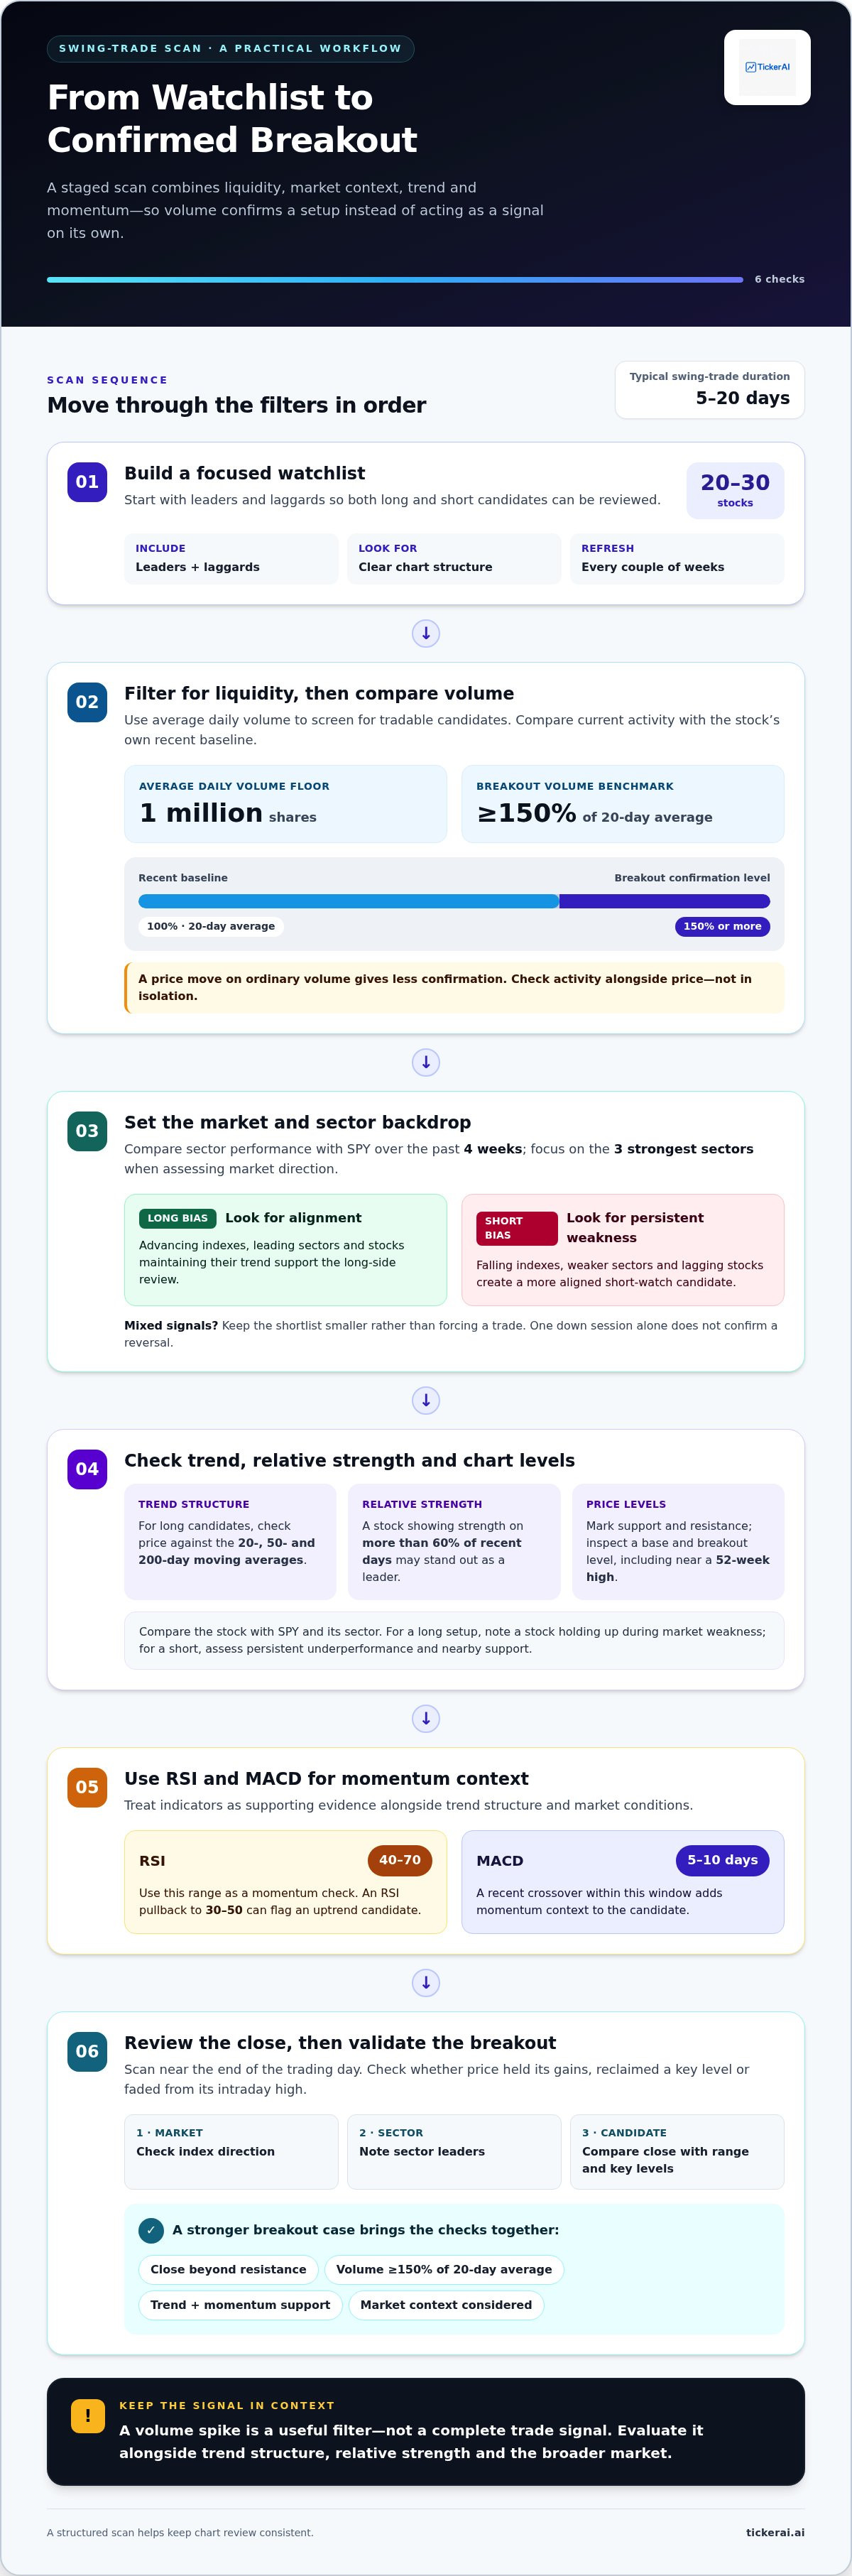
A breakout is more credible when volume reaches at least 150% of its 20-day average. To learn how to scan for swing trade opportunities, start with a focused watchlist of 20-30 stocks, then combine volume confirmation with momentum signals such as RSI in the 40-70 range. A volume spike is a useful filter, not a complete trade signal.
It’s easy to spot a price breaking above resistance. The harder part is judging whether momentum supports the move or it may fade. Volume shows how much trading activity backs the breakout, while RSI and MACD can help assess momentum.
This guide explains how to scan for swing trade opportunities with a practical workflow: narrow your watchlist, check market and sector conditions, and combine breakout volume with RSI and MACD signals. You’ll also learn to assess gap-ups and pullbacks, then turn promising candidates into setups with clear entry and risk criteria.
Key Takeaways
- Build a focused watchlist of 20-30 stocks, then filter for average volume of at least 1 million shares to prioritize liquidity.
- Compare sector performance with SPY over the past 4 weeks and focus on the 3 strongest sectors when assessing market direction.
- For long-trade candidates, check whether price is above the 20-, 50-, and 200-day moving averages before assessing a breakout or pullback.
- Use RSI and MACD together: an RSI pullback to 30-50 can flag an uptrend candidate, while a recent MACD crossover within 5-10 days adds momentum context.
- Treat breakout volume as confirmation, not a standalone signal; evaluate it alongside trend structure, relative strength, and the broader market.
How to select the stock for swing trading?
A swing trade aims to capture a price move over several days; a typical swing trade lasts 5-20 days. To scan support and resistance breakouts, mark those levels on each chart, then look for a close beyond resistance or below support with confirming volume.
-
Build a Watchlist of Strong and Weak Stocks
Start with 20-30 stocks, split between leaders and laggards so you can evaluate long and short candidates. Favor companies with clear chart structure and enough trading history to identify support, resistance, and trend direction. Refresh the list every couple of weeks. Avoid adding every ticker that appears in a daily screener; a focused list makes repeated chart review more consistent.
-
Screen for Unusually High Daily Volume
Filter for average daily volume of at least 1 million shares, then compare current activity with the stock’s own recent baseline. A breakout is more compelling when volume reaches at least 150% of its 20-day average. For example, a price moving above resistance on ordinary volume gives less confirmation than the same move with a clear activity surge. Check volume alongside price, not in isolation.
-
Find Relative Strength and Leading Stocks
Compare each stock’s performance with the broader market and its peers before ranking candidates. A stock showing relative strength on more than 60% of recent days can stand out as a potential leader. For a long setup, prioritize shares holding up during market weakness rather than simply rising on a strong index day. For short candidates, identify persistent underperformers, then assess their trend and nearby support.
-
Scan for Stocks at 52-Week Highs
Run a screen for stocks approaching or reaching a 52-week high, then inspect the base and breakout level on the chart. A stock at a new high has no previous buyers above that level waiting to sell at break-even, which can reduce overhead selling pressure. Still, don’t treat a high alone as an entry signal. Look for a sound base and breakout volume at least 150% of the 20-day average.
- Reject weak candidates before they reach your shortlist. Avoid selecting a stock solely because it rose sharply in one session, has a high RSI, or appears often in market headlines. Check whether its average volume meets the 1 million-share screen, whether its chart offers identifiable support or resistance, and whether momentum aligns with the trade direction. Keep the final list near 20-30 names so each chart receives focused review.
Checking market conditions before choosing long or short trades
Use sector leadership and index direction to establish a long or short bias before reviewing individual charts. Then check whether strong stocks are holding up as the broader market weakens.
-
Assess Sector Strength and Market Conditions
Compare sector performance with SPY over the past 4 weeks, then focus on stocks within the 3 best-performing sectors. This relative check helps distinguish broad leadership from a single stock’s isolated move. For a potential long, look for a sector outperforming SPY and a stock maintaining its trend. For short candidates, examine weaker sectors and avoid treating one down session as a confirmed reversal.
Next, review the overall market’s price action and the direction of major indexes. If indexes are advancing and leading sectors are participating, prioritize long setups with clear momentum. If indexes are falling, scrutinize long candidates more closely and assess whether short candidates show persistent weakness. A stock showing relative strength on more than 60% of recent days may merit closer attention, especially when it resists broad market declines.
-
Scan Near the Market Close
Run your scan near the end of the trading day because this approach relies on closing prices. A late-session review makes it easier to judge whether a stock held its gains, reclaimed a key level, or faded from its intraday high. Before adding it to your candidate list, compare the close with the day’s range and nearby support or resistance.
Follow the same review sequence each session: check index direction, note sector leaders, then compare candidates with their closing levels. For example, if SPY weakens but a stock closes near its daily high, record that relative resilience for further chart analysis. Don’t mistake an intraday spike for a closing signal. The final price can change how strong a setup appears.
- Separate market strength from individual-stock strength. Compare each candidate’s daily move with its sector and SPY. A stock rising on a down-market day may show resilience, particularly if its sector is also outperforming. If the sector falls while the stock holds firm, note the divergence and inspect the chart structure. A stock rising only because its sector surged may show less independent leadership.
Apply these checks before choosing direction. For instance, a weak index, underperforming sector, and lagging stock create a more aligned short-watch candidate than a strong stock in a strong sector. Mixed signals call for a smaller shortlist, not a forced trade. A structured stock opportunity scan can help organize candidates for this market-context review.
Why Liquidity Matters for Swing Trading?
- Set a volume filter before reviewing charts. Screen for average daily volume of at least 1 million shares, then compare today’s activity with the stock’s own baseline. Share volume measures traded units, while chart volume shows when activity is increasing or fading. A stock that meets the average-volume screen can still have quiet sessions, so review recent daily bars before treating it as an active candidate.
Liquidity affects how easily orders can be matched. When trading activity is thin and buyers or sellers are limited, the displayed price may be less useful. Check the bid-ask spread and available depth near the current price. For example, if the spread widens as volume drops, account for that friction when assessing a setup’s potential.
- Use screening and charting tools in two stages. First, filter by average volume, price movement, and technical conditions. Then open each result in a chart and inspect its trend, recent ranges, and nearby support or resistance. A screener narrows the market to a review list, but the chart shows whether a volume spike occurred during a breakout, reversal, or unstable price swing.
Keep the same settings across scans. If one screen uses average volume and another uses only today’s volume, their results aren’t directly comparable. Record your filters, then note which candidates still show orderly price action. Treat a platform’s results as a starting point for analysis, not a substitute for it.
- Compare volume with the price move. Look for activity supporting the direction of the setup. A breakout reaching at least 150% of its 20-day average volume has stronger participation than a similar move on routine activity. Check whether price closes beyond the level, rather than reacting only to an intraday push. Volume confirms participation; it doesn’t establish whether the move will continue.
Inspect volume during pullbacks, too. A retreat on lighter activity than the preceding advance may indicate less selling pressure than a decline accompanied by rising volume. Compare several sessions instead of relying on a single bar. On the chart, note the volume baseline and the price level that would invalidate your setup.
- Review and refine your method using recorded examples. Log each screened candidate’s average volume, spread conditions, chart pattern, and the reason it passed your filters. Once the setup resolves, review whether the volume signal aligned with price action. If candidates repeatedly fail because of thin activity or erratic spreads, tighten the liquidity filter before your next scan.
Keep your reviews consistent. Compare like with like, such as breakout candidates with other breakout candidates, rather than mixing them with pullbacks. A trading journal makes platform screens part of a repeatable process and helps reveal whether your rules identify clear charts or simply produce a long list of active tickers.
How do gap-ups signal opportunities in swing trading?
Use weekly charts to assess the broader trend and daily charts to evaluate entries and stops. Limit risk to 2% of your portfolio per trade; divide that risk amount by the per-share distance from entry to stop to estimate position size. Overnight gaps can move prices beyond planned stop levels, and earnings announcements can trigger sharp gaps in either direction.
- Check whether the gap aligns with a sound base and market trend. A gap-up is more relevant when price breaks out from a well-formed base, shows strong relative strength, and fits the broader market context. An opening jump without that structure can fade quickly. Mark the base resistance and compare it with the opening price before treating the gap as a candidate setup.
For a long candidate, look for price above its 20-, 50-, and 200-day moving averages. Those levels help you assess whether short-, intermediate-, and longer-term trend conditions align. A gap above resistance while price holds above these averages offers a clearer trend context than a gap against them. Keep the weekly chart open to see whether the daily breakout conflicts with the broader direction.
- Use the 21-day EMA to assess pullbacks after the gap. The 21-day exponential moving average can serve as a reference for pullbacks in trending stocks. Avoid assuming that a brief move toward the average is an entry signal. Wait for the stock to stabilize and bounce from the EMA. A reclaim accompanied by renewed momentum and increased volume gives the setup more structure.
Compare the pullback with the stock’s average daily range. If the gap has already used much of its usual daily movement, chasing the opening price may leave less room for a defined stop. Use recent chart ranges to judge whether price is extended or consolidating. Average daily range describes typical movement; it doesn’t predict the next session’s high or low.
- Set a volatility-based stop before sizing the trade. One possible technical stop distance is 1.5 times average true range from entry. ATR reflects recent price movement, so it can help frame a stop relative to volatility rather than using an arbitrary distance. Compare that level with nearby chart structure, such as the base or pullback low, and define the exit before entering.
Calculate position size from the amount at risk and the distance between entry and stop. For example, divide the portfolio risk allowance by the per-share loss at the stop. Keep the risk at or below 2% of the portfolio for a single trade. A stop order may not execute at or near its stop price, especially during a gap, so position sizing cannot remove gap risk.
- Review overnight catalysts before holding through the close. Earnings announcements can create price gaps that bypass a planned exit level. Check the company’s earnings calendar and consider whether your setup depends on holding through an event. Overnight news can also shift market sentiment before the next session, creating execution uncertainty even when the daily chart remains intact.
Record the gap level, moving averages, ATR-based stop, and event risk in your trade plan. If price loses the breakout level or closes below your chosen technical stop, follow your exit criteria rather than automatically widening the stop. Past performance doesn’t guarantee future results, and investing involves risk, including possible loss of principal.
RSI and MACD momentum signals
Combine trend, momentum, and relative strength instead of treating any one indicator as a standalone signal. Use moving averages to define trend, RSI to assess momentum, MACD to identify recent momentum shifts, and relative strength to compare a stock with the market.
- Set the trend filter with moving averages. Check whether price is above its 20-, 50-, and 200-day moving averages before prioritizing a long candidate. The alignment gives context for interpreting RSI and MACD. A bullish MACD crossover carries different weight when price is below those trend references than when price is holding above them.
For a short candidate, first confirm that the chart shows a downtrend. Then assess whether momentum indicators point in the same direction. Don’t use a moving-average crossover alone as an entry trigger; also compare price structure, recent highs and lows, and the stock’s performance against the broader market.
- Screen RSI according to the trend and trade direction. In an uptrend, use an RSI pullback to 30-50 as a screening range for potential long setups. This can identify a stock whose momentum has cooled without assuming the trend has ended. Review price action near support and look for signs that buyers are returning before considering the setup further.
For short candidates in a downtrend, screen for RSI between 50 and 70. This range can help flag a rebound within weakness, rather than a stock already extending lower. RSI measures momentum, not direction by itself. Confirm that the chart’s trend and the intended trade agree before advancing a candidate.
- Use MACD to check for a recent momentum shift. Look for a MACD crossover within the past 5-10 days, then compare it with price movement and the trend filter. A bullish crossover alongside an uptrend and an RSI pullback may identify renewed momentum. A crossover against the prevailing trend needs closer scrutiny.
Check the signal on the daily chart and note whether price is approaching resistance or support. MACD can lag because it is derived from price data, so a crossover may appear after much of a move has occurred. Use it as confirmation within a broader scan, not as a forecast of the next price swing.
- Rank candidates using relative strength. Compare the stock’s performance with the market and its sector. Relative strength on more than 60% of recent days can help identify potential leaders. For a long setup, prioritize stocks holding up during market weakness; for a short, examine persistent underperformance alongside a downtrend.
Build a scan sequence: trend filter first, RSI range second, recent MACD crossover third, and relative strength last. Keep candidates that align across those checks, then inspect their charts for a clear setup. Explore momentum-based swing trade setups to apply these signals to a focused candidate list.
TickerAI: AI Stock Opportunity Discovery
TickerAI’s AI Stock Opportunity Discovery helps surface market candidates for further review. Use its Swing Trade Setups to assess potential entries alongside your own trend, volume, RSI, and MACD criteria. Smart Watchlist & Alerts can help you organize tickers for ongoing monitoring, while Long-Term Investment Ideas suit a different time horizon.
Use these tools when manual screening leaves too many charts to sort or you want a structured stream of ideas to assess against your trading plan. Signals inform your analysis; they don’t replace checks of price action, risk, and market context.
Visit TickerAI to explore its stock opportunity discovery tools.
Make Your Next Scan More Deliberate
Make your process repeatable to improve your scans. Decide how to scan for swing trade opportunities before the market moves: define the conditions that earn a ticker further review, and record why each candidate passes. Then compare the setup with what the chart actually did. That feedback can help you refine your criteria without reacting to every new signal.
If you want help surfacing candidates and keeping them organized, TickerAI offers AI Stock Opportunity Discovery, Swing Trade Setups, and Smart Watchlist & Alerts. Use these tools to support your own review and decisions, not replace a trading plan. Choose a scan workflow that fits how you evaluate the market.
Contact TickerAI to discuss your scan, then keep testing and refining your process with focus.
Frequently Asked Questions
How can high volume confirm a stock’s breakout?
Compare breakout-day volume with the stock’s 20-day average. Activity reaching at least 150% of that average shows stronger participation than a move on routine volume. Then check where the stock closes: a close beyond resistance provides more evidence than a brief intraday break that reverses. Volume confirms participation, but it can’t establish whether the breakout will continue. Review the chart structure before treating the signal as a setup.
What makes relative strength important for swing trading?
Relative strength shows how a stock performs against a benchmark or its sector, adding context beyond its price change alone. For example, a stock that holds firm as its sector declines may be attracting more demand than its peers. That divergence can help prioritize a chart for review. Compare performance over the same period, and distinguish sustained resilience from an unusual single session before drawing conclusions.
Why do swing traders focus on 52-week highs?
A stock reaching a 52-week high may have less overhead selling pressure from investors waiting to exit at their previous purchase prices. Traders use the level to find potential leaders and assess whether price can establish support above a former ceiling. A high by itself isn’t an entry signal. Check the surrounding base, closing price, and trading activity to judge whether the move has structure.
Which technical indicators help identify swing trade entry and exit signals?
RSI, MACD, moving averages, and ATR-based tools each answer different questions. RSI helps assess momentum, MACD crossovers can flag a shift, and moving averages provide trend context. One method uses the first daily close back above the ATR Stops line after price has been below it as an entry signal, and a daily close below that line as an exit signal. Confirm signals against price structure.
How to identify swing trade setups using candlestick patterns and chart trends?
Start with the trend, then read each candlestick in relation to nearby support or resistance. For example, a bullish reversal candle near support matters more when price is already forming higher lows than during a clear downtrend. Check whether the next session confirms or erases the move. Treat candle shapes as evidence of that session’s buying and selling, not as standalone predictions.
How to set entry prices, stop-loss orders, and profit targets for a swing trade?
Define the setup’s trigger first, such as a daily close above resistance, then place the stop where the chart invalidates the idea. Size the position by dividing the amount you’re willing to risk by the per-share distance from entry to stop; the suggested portfolio risk limit is 2% per trade. Set a target near a meaningful resistance area. A stop order may execute away from its stop price.
Which U.S. stock screeners and broker tools can scan for swing trade opportunities?
Choose a stock screener that filters by average volume, price action, moving averages, RSI, and recent highs, then use charting tools to inspect candidates. Broker platforms may combine screening, charts, and order entry, but scanning and execution are separate tasks. For automated candidate discovery and organized monitoring, TickerAI offers AI Stock Opportunity Discovery and Smart Watchlist & Alerts. Assess each result against your own setup and risk rules.


