

The best stock scanner setup starts before you choose a filter. To learn how to set up a stock market scanner, first define the trading setup you want to find, then select a stock universe and the variables that describe it. The scanner’s engine applies those criteria and returns matching stocks. For intraday screening, use signals on 60-minute, 15-minute, or 5-minute data, depending on the setup.
It’s tempting to start by adding indicators and tightening filters. But without a clear setup, a scanner can produce a busy list that doesn’t support a specific trading decision. First define the pattern or market condition you want to find, then translate it into criteria you can screen and review.
This guide explains what a stock scanner is and walks through a practical setup workflow. You’ll learn how to adapt scans for intraday data, use major indexes for context, define trading setups before screening, and research matching stocks. The goal is a focused candidate list, not an automatic trade signal.
Key Takeaways
- Choose intraday data intervals that fit your intended holding period, then adapt scan conditions to those signals.
- Use major indexes to assess the broader market context before interpreting an individual stock’s movement.
- Define the setup you want to find before choosing indicators, so each filter serves a clear screening purpose.
- Treat scan results as a shortlist for further research, not as a buy signal; review charts, sector context, and company information.
- Combine price, volume, and market capitalization filters to narrow the universe while keeping the criteria aligned with your strategy.
Adapting the scanner for intraday data
- Start with historical daily prices, then add intraday bars for faster signals. A practical workflow retrieves two years of daily price data for each ticker, calculates baseline indicators, and monitors shorter intervals. Daily history provides context, but it doesn’t replace live intraday observations.
Use 60-minute, 15-minute, or 5-minute signals to match the setup you’re screening. A 60-minute bar can help track a developing move, while a 5-minute bar captures shorter-term changes. Keep the interval consistent when comparing volume and price conditions.
- Store clean ticker-level data in Feather files when your workflow needs fast local reads. Keep each ticker’s timestamp, open, high, low, close, and volume fields consistent. Use a clear filename, such as a ticker symbol paired with its data interval, and record the latest timestamp separately. This makes it easier to refresh data without mixing daily and intraday bars.
Check timestamps before running filters. Confirm that the newest bar belongs to the intended trading session and that the scanner isn’t reading an older file. A delayed or incomplete bar can distort relative volume, moving averages, and price-change signals.
- Keep data scans and news scans distinct. A data scanner flags price, volume, or indicator conditions; a news scanner monitors headlines and company announcements. They answer different questions: a volume spike can reveal unusual activity, while a news scan may help explain what coincided with it. Treat both as prompts for review, not complete trading rationales.
- Which stock scanning platforms are best in the United States? Choose a platform based on its intraday intervals, filter flexibility, data timeliness, and ability to save scans or alerts. The right fit depends on your setup and workflow, not on a universal ranking.
Are free stock scanners available, and how do they compare with paid tools? Free scanners can handle basic filtering, while paid tools may provide different data access or workflow features. Compare the specific intervals, filters, and alert functions your scan requires.
- How much do popular stock scanner subscriptions cost? Subscription pricing varies by platform, data access, and included features; review the applicable plan terms for the scanner you use. Set an alert only after defining its trigger, such as a 3% move in either direction, then save the scan and test it during market hours.
What risks and limitations should I know when using stock scanners? Scanners rely on timely, accurate data and may miss context, including news and broader market conditions. A match is a research lead, not proof that a trade is suitable. Review the chart and the underlying signal data before acting.
Using major stock indexes as screening criteria
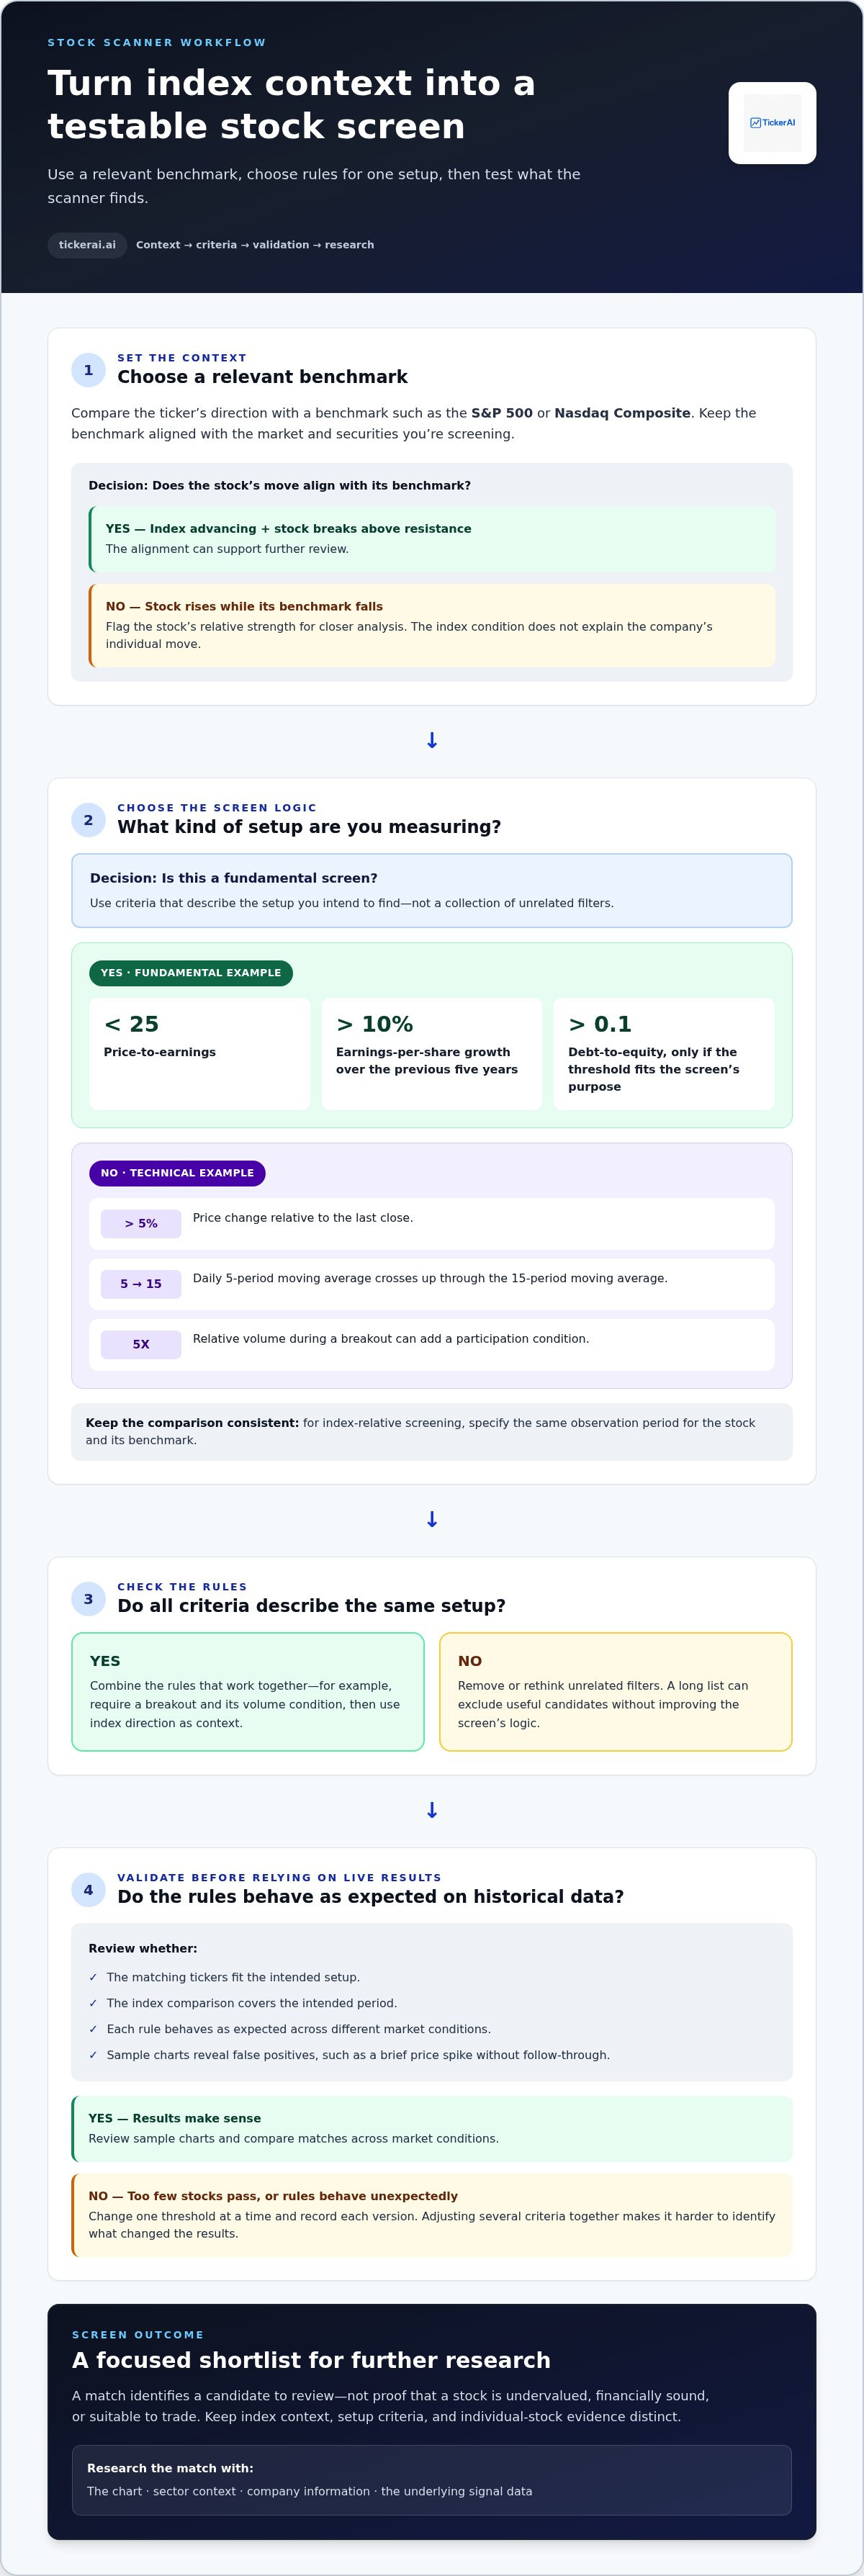
- Use an index as market context, not as a substitute for stock-level filters. Compare a ticker’s direction with a relevant benchmark, such as the S&P 500 or Nasdaq Composite. If the index is advancing while a stock breaks above resistance, that alignment can support further review. If the stock rises while its benchmark falls, flag the relative strength for closer analysis. An index condition can narrow a broad universe, but it won’t explain a company’s individual move. Keep the benchmark aligned with the market and securities you’re screening.
- Translate each setup into measurable screener criteria. For a fundamental example, set price-to-earnings below 25 and earnings-per-share growth above 10% over the previous five years. Add debt-to-equity above 0.1 only if that threshold fits the screen’s purpose. These criteria identify matching records; they don’t establish that a stock is undervalued or financially sound. For an index-relative scan, state the comparison clearly, such as a stock outperforming its benchmark over the same observation period. Keep the data field and timeframe consistent across every match.
- Build technical rules from observable events. One example is a price change greater than 5% of the last close. Another is a daily 5-period moving average crossing up through a 15-period moving average. A relative-volume criterion of 5X during a breakout can add a participation condition. Combine only rules that describe the same setup. For instance, require the breakout and volume condition together, then use the index direction as context. A long list of unrelated filters can exclude useful candidates without improving the screen’s logic.
- Test the screener on historical data before relying on live results. Review which tickers match, whether the index comparison covers the intended period, and whether each rule behaves as expected. If too few stocks pass, change one threshold at a time. Adjusting several criteria together makes it hard to tell which change affected the results. Record each version and compare its matches across different market conditions. Then check sample charts for false positives, such as a brief price spike that meets the rule but lacks follow-through.
Once the criteria are coherent, use AI stock opportunity discovery as another way to surface candidates for research. Keep the index, setup, and individual stock evidence distinct when evaluating each match.
Defining trading setups before scanning
- Write down the market behavior you want to detect before choosing indicators. A reversal setup looks for evidence that selling pressure may be easing. A continuation setup looks for a move that remains aligned with an established trend. Each calls for different scan logic. To learn how to set up a stock market scanner, describe the pattern in plain language first, then identify the price or indicator event that would make it measurable. This keeps the scan focused on a specific research task instead of mixing unrelated signals.
- Translate that description into an observable trigger and a matching timeframe. For a momentum-reversal example, use a daily RSI crossover up through 30. The scan detects the defined event; it doesn’t decide whether the chart supports a trade. For a trend-change example, compare an 8-period EMA with a 21-period EMA and specify which crossover matters. Keep the timeframe consistent across indicators. A daily RSI condition and an intraday moving-average signal describe different market windows, so combine them only when your setup calls for both.
- Add filters only when they clarify the pattern. Start with the trigger, then decide whether price direction, volume, or a broader trend condition should narrow the results. For example, pair an RSI recovery above 30 with a price-trend filter if you’re searching for potential reversals within a larger advance. Each added condition removes candidates. Check that it excludes the cases you intend to screen out, rather than shrinking the results without improving relevance. Record what each filter contributes and which market behavior it excludes.
- Test the full rule against historical charts before using it for live scanning. Review matching examples and non-matches, then check whether each trigger fits your setup description. Note cases where a brief indicator move creates a misleading match. Change one criterion at a time so you can trace its effect. If an RSI crossover at 30 produces too many weak matches, raising the threshold to 40 is one refinement example. If you’re learning how to set up a stock market scanner, compare the revised matches with the original rule before saving the scan.
The U.S. stock market has over 6,000 listed stocks moving simultaneously throughout the trading day, while scanners comb through millions of data points to find trading opportunities.
Researching stocks that match a screen
- Start with the ticker list returned by your web-based screener. Then retrieve historical data for that smaller group and apply your technical indicators and trading rules. This staged workflow keeps detailed analysis focused on candidates that meet your initial conditions. The scanner’s author reports that the example process produces 5-10 candidate stocks each morning. Treat that figure as an example output, not a target to force. If your screen returns too many names, inspect which initial criteria are broad. If it returns very few, review whether the setup’s conditions are overly restrictive.
- Open each candidate’s three-month price chart before drawing conclusions. Check the trend, nearby support and resistance, gaps, and price action around the scan trigger. A stock that meets a breakout rule may already have moved sharply by the time you review it. Match the chart review to the scan’s timeframe, so you don’t judge a daily signal using an unrelated intraday pattern. Sector distribution charts can also reveal whether results cluster in one industry. That concentration may point to a shared market driver rather than independent signals across the broader market.
- Review the indicator values behind each match. A scanner can calculate RSI, MACD, ATR, and moving averages in Python, but each describes a different aspect of price behavior. RSI characterizes momentum; MACD compares moving averages; ATR measures price movement; and moving averages help show trend direction. Check the underlying price bars alongside each output. If MACD meets your rule while the chart shows a sharp gap, decide whether the signal still fits your written setup. Analysis should connect computed results to visible market behavior, not stop at a row of indicator readings.
- Research the company and the event behind the price action before deciding how to respond to a match. Review recent company announcements, earnings information, sector developments, and the timing of the scan signal. Confirm that the chart and indicator calculations use the same data period. A screening result starts your research; it is not a complete stock assessment. Record why each ticker passed, what could invalidate the setup, and what evidence you still need. This creates a traceable decision process and makes later reviews more useful, especially when a similar pattern appears again.
What are common stock scanner filters for price, volume, and market capitalization?
- Set a minimum share price to narrow the universe before applying technical conditions. Trading above $50.00 per share is one example scanner criterion. Use it as a parameter for a particular screen, not as a universal measure of quality. A price filter can exclude stocks outside your intended range, but it doesn’t assess liquidity, volatility, or company fundamentals by itself. Pair it with filters tied to your setup. For example, if your scan seeks active breakout candidates, combine the chosen price condition with a volume rule and review the resulting charts.
Decide whether your scan needs a price floor, a ceiling, or both. A floor excludes lower-priced tickers; a ceiling can remove shares outside your strategy’s target range. Record why each boundary belongs in the scan.
- Measure volume against a relevant baseline rather than relying on raw share count alone. One example criterion is hourly relative volume greater than double the 10-day average volume. This compares current hourly activity with the stated average and can flag a possible increase in participation. Confirm that the screener uses compatible time periods. Comparing an incomplete hour with a full-session average can make the result difficult to interpret.
Pair the volume signal with the price behavior your setup requires. A volume increase during a breakout differs from elevated activity during a selloff. Review the chart and confirm that the scan interval matches the event you want to find.
- Add market capitalization when company size matters to your strategy. A $1 billion minimum market capitalization is one example filter that can exclude volatile micro-cap stocks. It narrows the universe by company size, but it doesn’t eliminate price swings or establish that a ticker is liquid. Check how the screener defines market capitalization and how often that field updates. Then assess the remaining candidates using your price and volume rules.
Treat size, price, and volume as separate controls. Each answers a different question: which share-price range fits, how much trading activity is present, and which company-size range remains.
- Test the combined screen instead of stacking thresholds without review. Start with the intended setup, apply the price range, add the relative-volume condition, then set a market-capitalization floor if relevant. Check which tickers pass and whether their charts show the pattern you want. If a filter removes relevant candidates, revise that condition alone. This isolates its effect and keeps the criteria explainable. Save the final scan with a purpose-specific name, such as “hourly volume breakout,” rather than a generic label.
For another way to surface stocks for research, explore AI stock opportunity discovery and compare its candidates with your own price, volume, and size criteria.
TickerAI: AI Stock Opportunity Discovery
TickerAI’s AI Stock Opportunity Discovery can help traders surface stocks for review alongside their own scans. Swing Trade Setups, Smart Watchlist & Alerts, and Long-Term Investment Ideas support different research needs, from tracking potential shorter-term opportunities to monitoring ideas over a longer horizon. Use these tools to complement your screening process, then assess each candidate against your criteria and review the relevant market data. They’re designed to support structured opportunity discovery, not replace your evaluation of a stock’s setup and risks.
Explore TickerAI at tickerai.ai to see how its stock opportunity tools fit your workflow.
Put Your Scanner to Work With a Clear Process
A scanner is more useful as part of a repeatable decision process. Before your next session, write down what qualifies as a match, what evidence you’ll review, and what would invalidate the setup. Then record how each result behaves. This feedback gives you a practical basis for refining your criteria instead of changing filters on impulse.
If you’re deciding how to set up a stock market scanner for a specific workflow, connect the screening rules to the decisions you need to make. A tool can surface candidates, but your process determines how you evaluate them and whether they fit your plan. Keep the scan focused, review its output consistently, and refine it as your approach develops.
Contact TickerAI to discuss your scanner and explore how its stock opportunity tools may fit your research workflow. Take the next step with a clear setup and a disciplined review process.
Frequently Asked Questions
What is a Scanner?
A scanner searches a defined set of data for conditions you choose. In stock trading, you might ask it to flag shares that cross a price threshold or show unusually high volume. The scanner returns matches for review. It doesn’t determine whether a match fits your plan, explain every market move, or place a trade. Those decisions require separate analysis.
What is a stock market scanner and how does it work?
A stock market scanner applies filters to stock data and returns tickers that meet them. You select the market universe, data fields, and conditions, such as price movement or an indicator signal. The scanner checks available data against those rules. For example, a scan can flag a ticker when a specified chart event occurs. Treat the results as candidates to investigate, not recommendations.
How do I set up a stock scanner step by step?
Start by describing a specific setup in plain language, such as “find stocks showing a momentum reversal.” Choose the stock universe and timeframe, then translate the setup into measurable conditions. Run the scan and inspect several matching charts to see whether the results fit your description. Adjust one condition at a time, save the version that works as intended, and review its output in the next session.
Which stock scanner criteria should beginners use?
Beginners can start with a small set of understandable filters, then add complexity only when each rule has a purpose. For example, a screen might require a share price above $50.00, hourly relative volume greater than double the 10-day average, and a minimum market capitalization of $1 billion. These are example criteria, not universal settings. Review whether each one narrows the universe in a useful way.
How can I scan for breakouts, momentum, and unusual trading volume?
Build a separate scan for each pattern, or combine conditions only when they describe the same setup. A breakout example is a price change greater than 5% of the last close, paired with relative volume of 5X. For momentum reversal, a daily RSI crossover up through 30 offers a measurable trigger. Check the matching chart and confirm its timeframe aligns with the rule before researching the ticker further.
Which stock scanning platforms are best in the United States?
Choose a platform based on its intraday intervals, filter flexibility, data timeliness, and ability to save scans or alerts. The right fit depends on your setup and workflow, not on a universal ranking.


