

A sub-$50 share price is a filter, not proof of value. Stocks under $50 can look more accessible, but the price per share alone won’t tell you whether a company is financially sound, attractively valued, or exposed to outsized risk.
It’s reasonable to start with a price ceiling. The challenge is what comes next: stock lists can go stale as prices move, and comparing companies across sectors by share price can lead to misleading conclusions. A lower-priced stock isn’t automatically a bargain, just as a higher-priced one isn’t necessarily out of reach.
This guide shows you how to build a repeatable screen and assess candidates using valuation, financial quality, liquidity, and risk. You’ll also learn how to keep a watchlist current and use timely signals to prioritize independent research. AI-powered opportunity discovery and alerts can help surface and monitor candidates, but they’re inputs to your process, not substitutes for evaluating a business and managing risk.
Key Takeaways
- Use stocks under $50 as a starting filter, then assess each company’s fundamentals, valuation, liquidity, catalysts, and downside risks.
- Compare candidates with relevant peers in the same sector instead of applying one metric across different industries.
- Build a comparison table that records each data point’s source and date so changing market information stays in context.
- Follow a repeatable workflow: set a price threshold, define criteria, screen, verify, compare, and monitor candidates.
- Use AI-driven discovery, smart watchlists, and alerts to surface and track candidates, then apply your own research and risk checks.
What does stocks under $50 actually mean for an investor?
Stocks under $50 are shares with a current market price below a screening threshold chosen by the investor. The cutoff defines which securities enter the screen. It doesn’t reveal a company’s valuation, size, business quality, or potential return. A share price is one data point, not an investment thesis.
Consider two companies with identical businesses. Company A has 1 million shares priced at $100, giving it a market capitalization of $100 million. If it completes a two-for-one stock split, it would have 2 million shares priced at $50, while its market capitalization would remain $100 million, assuming no other changes. The per-share quote changes, but the underlying business value doesn’t automatically change with it.
Does a low share price mean a stock is cheap?
No. Market capitalization is generally calculated by multiplying a company’s share price by its shares outstanding. It shows the total equity value in a way a share quote alone cannot. A $20 stock could represent a large company with many shares outstanding, while a $200 stock could represent a smaller company with fewer shares. Neither price, by itself, establishes which business is cheaper.
Stock splits make the distinction clear: they divide existing shares into more shares at a correspondingly adjusted price. They don’t automatically improve earnings, cash flow, or competitive position. To assess a company’s financial health and estimated intrinsic value, investors use fundamental analysis. A low quote doesn’t establish undervaluation or reduce downside risk.
Why investors use a $50 screening threshold
A $50 ceiling is a user-selected filter for narrowing a broad stock universe. It can make a search more manageable, but the cutoff is arbitrary. It may exclude a relevant company trading just above the threshold while including businesses with very different fundamentals and risk profiles. Treat the result as a screening universe, not a recommendation or a claim that its members are undervalued.
A price screen identifies shares that meet a chosen quote threshold; it doesn’t measure business value or investment risk.
Prices move, so a stock can enter or leave the screen as its market quote changes. Any example list should identify its market-data date and source, and you should verify current prices before relying on it. The useful next step is to evaluate each candidate on its fundamentals and compare it with relevant peers, rather than assuming every stock below the cutoff is a bargain.
How to assess stocks under $50 beyond the share price
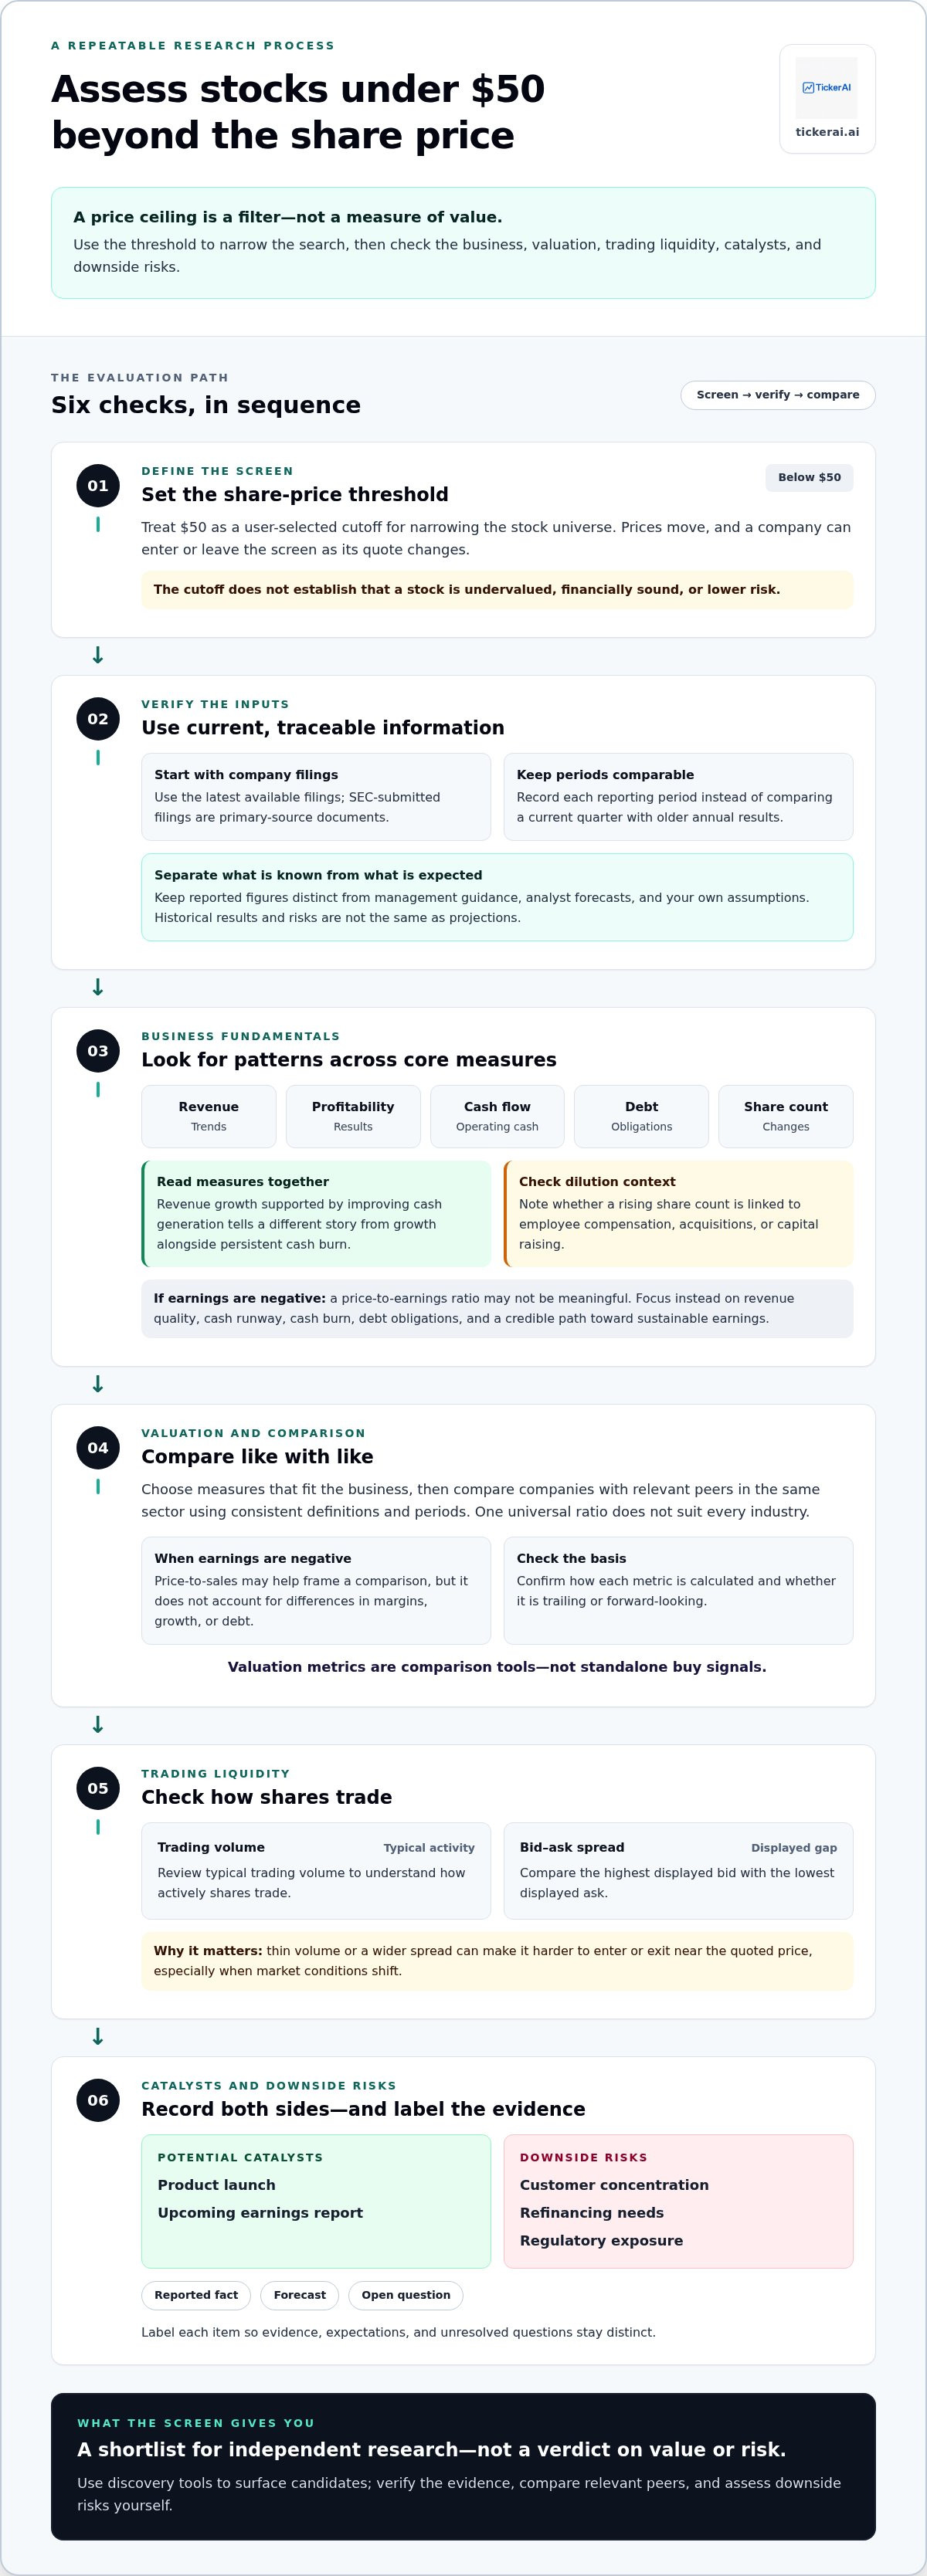
A useful first-pass screen tests more than price. For each candidate, examine five areas: business fundamentals, valuation, liquidity, potential catalysts, and downside risks. Apply the same questions to companies in the same sector, where business models and financial measures are more comparable. A software company and a bank, for example, shouldn’t be judged by one universal valuation ratio.
Start with the latest available company filings. Record the reporting period so you don’t compare one company’s current quarter with another’s older annual results. Keep reported figures separate from management guidance, analyst forecasts, and your own assumptions. That distinction makes the screen easier to verify and update.
Which fundamentals should a first-pass screen include?
Check revenue trends, profitability, operating cash flow, debt, and changes in shares outstanding. Look for patterns, not isolated figures: revenue growth alongside persistent cash burn tells a different story from growth supported by improving cash generation. Rising share count can dilute existing ownership, so note whether dilution is linked to employee compensation, acquisitions, or capital raising.
Negative earnings call for a different lens from established profitability. A price-to-earnings ratio may not be meaningful when earnings are negative; focus instead on revenue quality, cash runway, cash burn, debt obligations, and a credible path toward sustainable earnings. Use company filings submitted to the SEC as primary-source documents. They report historical results and risks; projections and guidance are estimates, not achieved outcomes.
How should valuation and liquidity be compared?
Choose valuation measures that fit the business and compare them with relevant sector peers using consistent definitions and periods. For example, a price-to-sales ratio may help frame a comparison when earnings are negative, but it doesn’t account for differences in margins, growth, or debt. Check how each metric is calculated and whether figures are trailing or forward-looking.
Valuation metrics are comparison tools, not standalone buy signals. A low ratio can reflect weaker prospects or higher risks, while a higher one may reflect expectations that still need to be tested against results.
Liquidity affects how easily shares can be traded near the quoted price. Review typical trading volume and the bid-ask spread, the gap between the highest displayed bid and lowest displayed ask. Thin volume or a wider spread can make entering or exiting a position more difficult, particularly when market conditions shift.
Finally, list possible catalysts, such as a product launch or an upcoming earnings report, alongside downside risks, including customer concentration, refinancing needs, or regulatory exposure. Label each item as a reported fact, a forecast, or an open question. AI-powered stock opportunity discovery can help surface candidates, while your own checks determine which deserve deeper research.
How to compare under-$50 stocks without relying on a static pick list
A static list can become outdated as prices and company results change. Instead, build a comparison table that captures what you know, when you checked it, and what still needs verification. This turns stocks under $50 into a research universe you can refresh, not a set of supposedly current picks.
What belongs in a useful stock comparison table?
Give each candidate a row and use columns that make the comparison traceable:
- Identity: ticker, company name, and sector.
- Size: market capitalization, with the date checked.
- Financial context: revenue trend, profitability, cash flow, debt, and the reporting period covered.
- Valuation: relevant ratios, with definitions and whether the figures are trailing or forward-looking.
- Liquidity: typical trading volume and bid-ask spread, each tied to a date or observation period.
- Catalyst and uncertainty: a potential event or material unknown, supported by a dated source.
- Key risks: concise downside factors, not just the company’s growth narrative.
Label the source and date for every live-sensitive figure, such as share price, market capitalization, and trading volume. Financial results should identify the filing and period they cover. Mark unavailable or incomparable data as such; don’t fill gaps with estimates that look like reported facts. A short source note in each row helps you revisit the evidence without rebuilding the comparison from scratch.
How do sector and company size change the comparison?
Compare businesses with relevant peers, using the same financial periods and metric definitions. An early-stage company with negative earnings may need to be assessed through revenue trends, cash use, and financing needs. An established, profitable business can be examined through earnings, margins, and cash generation. Business models differ even within a sector, so record when a metric isn’t directly comparable.
The Russell 2000 can provide broad context for small-cap performance, but inclusion in a small-cap benchmark is not a quality endorsement. Company size alone doesn’t establish financial strength or reduce risk. For more context on how sector themes shape a research universe, see this guide to finding thematic investment opportunities with AI.
Keep the table neutral. Separate reported facts from forecasts, assumptions, and opinion, and give the risk column equal attention to catalysts. That discipline makes it easier to spot what has changed and decide which candidates warrant further independent research.
How to build a repeatable workflow for finding stocks under $50
A repeatable screen turns a price cutoff into an organized research process. It surfaces candidates for further review, not buy decisions. Before considering any trade, document the potential downside, define how much risk you’re willing to take, and decide what evidence would make you reassess the thesis.
What steps turn a price filter into a research process?
- Set a threshold. Choose a share-price ceiling and decide whether the screen applies to a particular market or universe.
- Define criteria. Add requirements that fit your approach, such as sector focus, liquidity, financial quality, or profitability. Keep the rules clear enough to apply consistently.
- Screen. Use the criteria to generate a manageable set of candidates. A match means only that a company passed the filter.
- Verify. Review recent filings and company information. Check the reporting period and source before relying on a headline, forecast, or alert.
- Compare. Evaluate candidates against relevant peers using consistent metrics. Record the rationale, supporting evidence, counter-evidence, and key risks for each one.
- Monitor. Add only researched candidates to a watchlist, then revisit them when new information or a predefined trigger appears.
For each candidate, write down what supports the thesis, what challenges it, and what would change your view. Set a risk plan before any trade decision, including the conditions that would invalidate the thesis or prompt a fresh review. This helps prevent a price move or alert from becoming a substitute for analysis.
How can a watchlist keep the screen useful over time?
A watchlist is a maintenance tool, not a collection of permanent picks. Track price changes, new filings, earnings dates, and developments tied to each company’s thesis. Record when you last reviewed the evidence, and remove candidates that no longer meet your original criteria. Note why they were removed. That history can help refine the screen and reduce repeated research.
For a structured approach to organizing candidates, read this guide on how to create an effective stock watchlist. Smart watchlists and real-time alerts can also help surface changes to review, but each signal still needs to be checked against your criteria and risk plan.
TickerAI’s stock discovery and watchlist tools can help surface and monitor candidates as part of an independent research workflow.
How TickerAI can support stock discovery under $50
Once your screening criteria and review process are in place, discovery tools can help you surface candidates and keep track of developments. TickerAI provides AI-driven stock opportunity discovery, smart watchlists, and real-time alerts. These tools can support research into stocks under $50, but they don’t replace your evaluation of a company or determine whether it fits your strategy.
Curated swing trade setups and long-term investment ideas can provide additional research inputs. Treat them as starting points for investigation, not personalized financial advice or instructions to execute a trade. Your price ceiling, company analysis, and risk plan remain central to the decision process.
Where do AI alerts fit in a sub-$50 stock workflow?
An alert is a prompt to investigate a change, not an automatic buy or sell instruction. If a candidate’s price moves or new information emerges, review the signal against your original criteria. Has the company’s financial picture changed? Does the stock still meet your threshold? Is the development relevant to your thesis, or simply market noise?
A smart watchlist helps organize candidates around the criteria you set, making it easier to track what prompted your interest and what evidence still needs review. For more context on evaluating algorithm-generated signals, read this guide on how to interpret AI stock signals.
What should investors do before acting on a discovery?
Recheck the live quote first. A stock may no longer fall below your chosen ceiling, and a past screen result isn’t proof that it still qualifies. Then return to primary-source information, such as recent company filings, and review liquidity, relevant risks, and the rationale you recorded when adding the candidate to your watchlist.
Before making a trade decision, confirm that the original thesis still holds and revisit your risk plan. If key evidence has changed, pause and reassess rather than treating an alert as confirmation. Discovery tools can help you focus attention; verification and risk management remain your responsibility.
TickerAI stock discovery helps surface and monitor research candidates within an independent screening process.
Turn Your Screen Into a Stronger Research Process
A price ceiling can narrow the field, but it can’t tell you whether a company is fairly valued or financially resilient. Treat stocks under $50 as candidates to investigate, then compare relevant peers using dated financial information, valuation context, liquidity, and downside risks.
A repeatable workflow keeps the process disciplined: define your criteria, verify the evidence, record your rationale, and monitor changes that could alter your view. A watchlist or alert can flag a development, but it’s a prompt for independent research, not a decision to buy or sell.
TickerAI supports discovery with AI-powered opportunity identification, smart watchlists, and real-time alerts. Curated swing trade setups and long-term investment ideas can add research inputs to your process, while your own checks guide what deserves further attention.
Ready to organize your search? Explore TickerAI stock discovery to support a clear, independent screening process. Build your criteria, stay curious, and let evidence lead your next step.
Frequently Asked Questions
Are stocks under $50 considered cheap?
No. A share price below $50 doesn’t show whether a stock is undervalued. Compare a company’s market capitalization, financial performance, valuation, and outlook with relevant peers. Two businesses can have very different share prices simply because they have different numbers of shares outstanding. A low quote may fit a screening rule, but it isn’t evidence of a bargain or lower risk.
How do I find stocks under $50 to research?
Use a stock screener to apply your chosen share-price ceiling, then add filters that reflect your research goals, such as sector, liquidity, profitability, or revenue trends. Treat the results as a candidate list, not a set of recommendations. Verify current prices and review recent filings before comparing companies. Record each candidate’s data sources, key risks, and reasons for further research so you can revisit the screen consistently.
Can stocks under $50 be good long-term investments?
Some may suit a long-term research process, but share price alone can’t establish whether a company is a sound investment. Examine its business model, competitive position, financial condition, valuation, and risks over time. Consider whether the company can fund its operations and support its plans. Compare it with relevant sector peers, and revisit the evidence as results and business conditions change. No price threshold guarantees long-term performance.
What should I check before buying a stock under $50?
First, confirm the current quote and whether the stock still meets your screen. Review recent company filings for revenue, profitability, cash flow, debt, share dilution, and disclosed risks. Then assess valuation against relevant peers and check trading volume and bid-ask spreads. Write down your investment rationale, counter-evidence, and conditions that would change your view. Set a risk plan before making any trade decision.
Are stocks under $50 riskier than higher-priced stocks?
Not necessarily because of price alone. A share’s quote doesn’t determine company size or financial quality. Risk depends on factors such as the business model, earnings stability, debt, liquidity, volatility, and competitive position. Some lower-priced securities can be speculative or volatile, so assess each company on its own evidence. Compare peers within the same sector, and don’t treat a higher share price as proof of lower risk.
How often should I update a watchlist of stocks under $50?
Review it on a consistent schedule and whenever a material event could change your thesis. Check for price movements, new filings, earnings updates, and developments specific to each company. Reconfirm that candidates still meet your screening criteria, including the price ceiling. Remove names that no longer qualify, and note why. A watchlist is a working research tool, not a permanent list of candidates.
Can AI find stocks under $50 for me?
AI-powered tools can help surface and monitor candidates, but they don’t replace independent research or decide whether a stock is suitable for you. TickerAI offers stock opportunity discovery, smart watchlists, real-time alerts, curated swing trade setups, and long-term investment ideas as research inputs. Verify each candidate’s live price, filings, liquidity, and risks. Treat an alert as a prompt to investigate, not an instruction to buy or sell.


