

A profitable streak can be the least reliable evidence that you have an edge. Developing an edge in the stock market means more than finding a signal that worked in hindsight. It means defining a repeatable setup and measuring whether its results hold up after trading costs and across changing conditions.
With strategies, market opinions, and AI-generated signals competing for attention, it’s hard to know which ideas deserve a closer look. And a handful of winning trades can’t establish that an approach will work again. Applying an untested idea with real capital adds risk before the evidence is clear.
This guide shows you how to define an edge in measurable terms, build a disciplined research and testing process, and assess results without confusing luck with proof. You’ll also learn how to use tools such as automated market scans, watchlists, and alerts to surface and organize opportunities, while keeping your own validation and risk controls in place. The goal is a practical framework for evaluating ideas before relying on them.
Key Takeaways
- Build a market hypothesis from observable behavior, then specify entry, exit, timeframe, and stock-selection rules before testing.
- Use backtests as an initial filter, not proof; compare in-sample and out-of-sample results to assess how well an idea may hold up.
- Developing an edge in the stock market requires evidence of repeatable outcomes, not a winning trade or short streak.
- Separate research findings from trade decisions by applying independent decision rules, risk controls, and post-trade review.
- Use AI scans and alerts to surface candidates for evaluation, not as substitutes for a validated thesis or your own judgment.
What Does Developing an Edge in the Stock Market Actually Mean?
An edge is a repeatable research or trading process that has evidence of favorable outcomes under defined conditions. It isn't a promise that every trade will win, or proof that future results will match past ones. A forecast, a confident opinion, or a chart that looks compelling may suggest an idea to investigate. None establishes an advantage on its own.
The Efficient-market hypothesis provides useful context: it holds that asset prices reflect available information, making consistent outperformance difficult. An edge therefore needs more than a persuasive story. It needs observable rules and evidence that can be tested, including against the possibility that a result came from chance.
How Is a Trading Edge Different from a Winning Streak?
A profitable trade is one outcome. A winning streak is a short run of outcomes. Neither shows whether a rule-based approach has an advantage across repeated opportunities. Chance can produce a favorable run, while selective memory makes wins easier to recall than losses. Survivorship bias can also skew a review when it focuses on successful stocks or strategies and overlooks those that disappeared or failed.
A lucky result is an outcome; an edge is a repeatable process supported by evidence across multiple observations.
What Can Create an Advantage in Stock Research?
Potential sources include a clearly defined setup, more disciplined information processing, a timing rule, or consistent risk management. These components can work together: a scan may identify a pattern, while entry and exit criteria determine whether it qualifies for further review. For broader context on systematic analysis, see this guide to quantitative investing.
An indicator, AI signal, or attractive chart is a tool or observation, not evidence of an edge by itself. It must be assessed within explicit rules and tested against relevant outcomes. Automated discovery can help surface and organize candidates; independent evaluation determines whether a candidate fits a testable idea.
Expect results to vary. Market conditions shift, and a pattern observed in one period may weaken or behave differently in another. Historical evidence can help assess an idea, but it can't guarantee future performance. Treat an edge as a hypothesis to monitor and reassess, not a permanent market advantage.
Build a Testable Market Hypothesis Before You Choose a Strategy
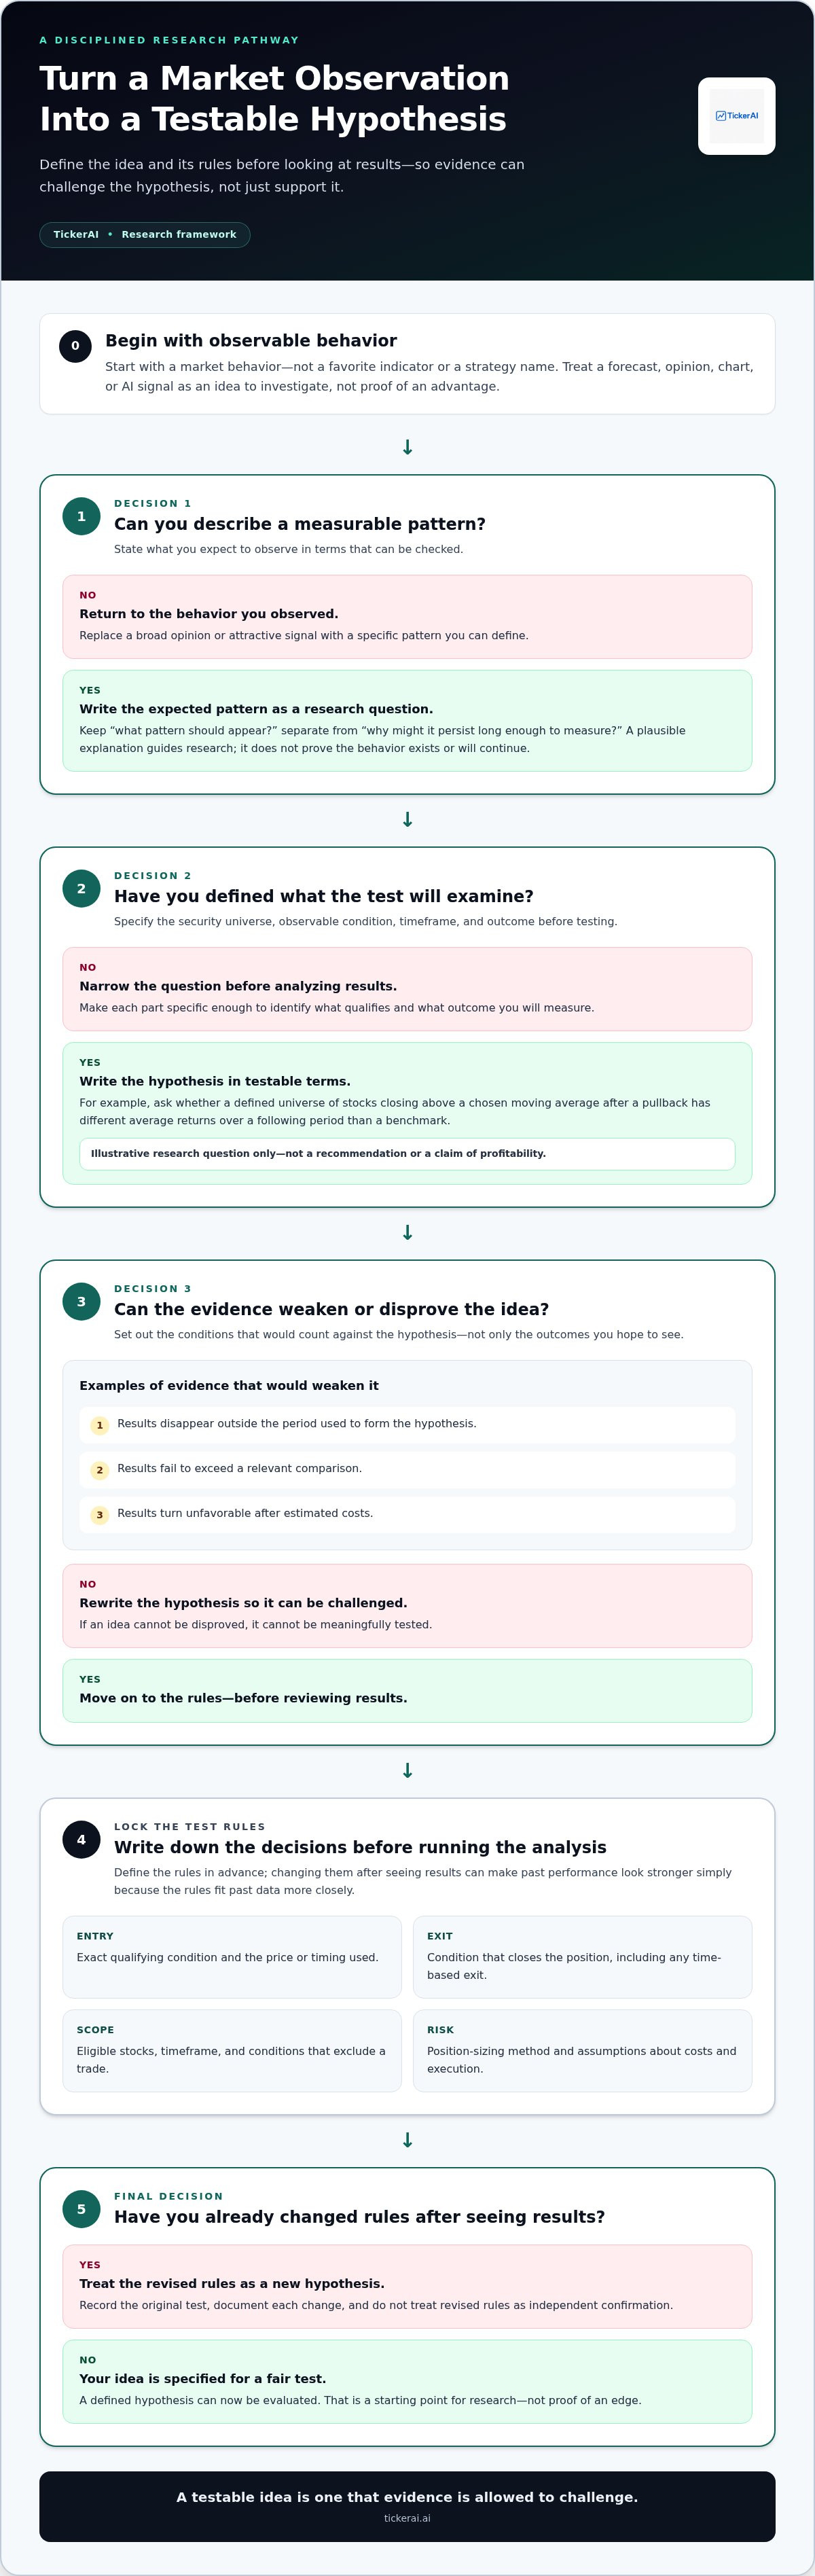
Start with a market behavior, not a favorite indicator or a strategy name. Then turn the observation into a hypothesis, define the rules that would test it, and evaluate the results. This order matters: if you choose rules only after seeing which ones performed well, you risk building a story around noise instead of testing an idea fairly.
Keep two questions separate. First, what pattern do you expect to observe? Second, why might it persist long enough to be measurable? A plausible explanation can guide research, but it doesn't prove the behavior exists or will continue. Developing an edge in the stock market calls for a hypothesis that can be challenged by evidence.
Turn a Market Observation into a Falsifiable Hypothesis
Specify the security universe, observable condition, timeframe, and outcome before testing. For example, a hypothetical study might examine whether stocks in a defined universe that close above a chosen moving average after a pullback have different average returns over the following period than a benchmark. This example is a research question, not a recommendation or a claim of profitability.
State what would weaken the idea: results disappear outside the period used to form the hypothesis, fail to exceed a relevant comparison, or turn unfavorable after estimated costs. A hypothesis that can’t be disproved can’t be meaningfully tested.
Define Rules Before Looking at the Results
Write down the decision rules before running the analysis. Include:
- Entry: The exact condition that qualifies a stock and the price or timing used.
- Exit: The condition that closes the position, including any time-based exit.
- Scope: Eligible stocks, timeframe, and conditions that exclude a trade.
- Risk: Position-sizing method and assumptions about costs and execution.
Changing these rules after reviewing results can create overfitting. A small adjustment may make historical performance look stronger simply because it fits past data more closely. Record the original test, document any changes, and treat revised rules as a new hypothesis to evaluate, not as independent confirmation.
A structured research workflow can help organize candidate ideas before you define and test your own rules. Explore this AI stock discovery platform guide for context on using discovery tools to surface stocks for independent analysis. The scan can prompt a question; it can’t validate the answer. TickerAI’s AI stock opportunity discovery can help surface candidates to examine within a disciplined research process.
How to Test Whether a Stock-Market Edge Holds Up
A backtest can reveal how a set of rules would have behaved on historical data. It can also expose weaknesses before you risk capital. But it can’t recreate every live-market condition, including actual fills, changing liquidity, or the effect of your own execution. Treat it as an initial filter, not proof that an approach will work in the future.
Separate the data used to develop the idea from data reserved to evaluate it. In-sample results show how the rules fit the period used to build them. Out-of-sample results test those fixed rules on a separate period. Better performance in the first than the second may signal overfitting. Even a positive out-of-sample result is evidence to investigate, not a guarantee.
Make the test realistic. Account for commissions and other transaction costs where applicable, slippage between an assumed price and a plausible fill, and liquidity constraints that could make an order difficult to execute. A backtest that assumes every trade fills instantly at an ideal price can overstate performance.
Which Results Matter Beyond a High Win Rate?
Win rate shows how often trades closed profitably, not how much they gained or lost. Expectancy combines the frequency and size of wins with the frequency and size of losses. A strategy can win often and still lose overall if occasional losses are much larger than typical gains.
Review drawdown, risk-adjusted performance, and consistency alongside expectancy. Drawdown captures declines from a previous peak; risk-adjusted measures put returns in context of the risk taken; consistency shows whether results depend on a narrow stretch of favorable conditions. No single measure proves an edge or assures future results.
How Can You Spot Overfitting and Changing Conditions?
Repeatedly tuning parameters until a backtest looks attractive can make rules fit historical noise. Keep a record of adjustments, preserve untouched data for evaluation, and compare results across distinct periods and market environments. If performance relies on one narrow window or collapses when assumptions change modestly, confidence should fall.
| Useful evidence | Warning signs |
|---|---|
| Results remain coherent on separate data. | Strong results appear only in the development sample. |
| Costs, slippage, liquidity, and plausible execution are considered. | Performance depends on ideal fills or ignores trading frictions. |
| Several measures and market periods tell a reasonably consistent story. | A high win rate masks large losses or results depend on one regime. |
Use the evidence as a basis for further review, not an automatic trade signal. A disciplined testing process helps make developing an edge in the stock market more rigorous, while keeping uncertainty visible.
Turn Evidence into a Repeatable Process with Risk Controls
Evidence only becomes useful when it informs a consistent workflow. Move each candidate through distinct stages: discovery, independent review, a decision against predefined rules, risk controls, and post-trade review. A scan or alert can surface an opportunity for investigation. It doesn’t establish that the idea is valid or require you to take a position.
Keep the trade decision separate from the research signal. Before acting, check whether the idea meets your criteria and whether the potential position fits the risk limits in your plan. Set position sizing and loss limits in advance, not in response to a fast-moving price or a strong opinion. That separation helps keep risk decisions consistent even when conviction rises or falls.
Use a Trading Journal to Evaluate Process Quality
Record the setup, rationale, planned risk, execution, and outcome for each trade you review. Note whether you followed the rules, separately from whether the trade made or lost money. A rule-following loss and a profitable trade that broke the plan tell you different things about process quality.
Over time, journal entries can reveal repeated execution errors, changing assumptions, or drift from the tested approach. For further context on maintaining discipline, see this guide to using AI to remove emotion from trading.
Review an Edge Without Assuming It Lasts Forever
Schedule periodic reviews and compare observed results with the original hypothesis and rules. Look for changes in volatility, liquidity, or market structure that could affect how a setup behaves. These are prompts for investigation, not proof that a strategy has stopped working or that a new condition will persist.
Use the review to choose a measured next step:
- Continue monitoring when the process remains consistent with its tested assumptions.
- Pause and investigate when execution, risk, or results depart from the plan.
- Revise and retest when evidence suggests the original conditions may have changed. Treat revised rules as a new version to evaluate.
A documented review cycle helps distinguish a temporary run of outcomes from a meaningful change in the process. That discipline is central to developing an edge in the stock market without treating historical evidence as permanent. To organize candidates for your independent review, explore TickerAI’s AI stock discovery tools.
Use AI Stock Discovery to Support Your Edge, Not Replace It
Automated stock scanning can help narrow a broad market into a more manageable set of candidates. It can surface patterns and organize opportunities for review, reducing the need to search manually across every stock. But discovery is only the first step. A candidate still needs to fit a testable thesis and your documented criteria before it informs a decision.
TickerAI offers AI-powered stock opportunity discovery, smart watchlists and alerts, curated swing trade setups, and long-term investment ideas. These can support different stages of research: scanning can surface candidates, watchlists can keep selected names organized, and alerts can prompt a timely review. For a deeper look at analysis workflows, read about automated stock market analysis.
Where Automated Stock Scanning Fits in the Workflow
Use scanning to focus attention, then evaluate each candidate independently. Check the market context, the assumptions behind the signal, liquidity, and whether the setup matches your entry and exit rules. An alert may indicate that a condition has appeared. It doesn’t establish that the condition has predictive value, or that a trade fits your risk plan.
This distinction matters when developing an edge in the stock market. A tool can help make research more systematic, but the edge must come from a process supported by evidence, not from the fact that software identified a stock.
What an AI Alert Can and Cannot Tell You
Think of an alert as a prompt to investigate, not a personalized recommendation or an execution instruction. Compare it with your own documented criteria. If it doesn’t meet them, there’s no need to force the idea into your process. If it does, review the evidence and apply your established risk controls before deciding what to do.
Idea discovery identifies candidates; it doesn’t prove predictive accuracy. That’s the practical boundary between an alert, a validated thesis, and a trade decision. The alert flags a condition. Research tests whether the condition supports your hypothesis. Your rules and risk limits govern whether you act.
If you want a structured way to surface stocks for independent research, explore TickerAI stock opportunity discovery. Use the ideas as inputs to your process, then let your evidence and risk controls guide the next step.
Make Your Research Process More Repeatable
A durable market edge starts with a testable idea, not a confident prediction. Define the conditions, evaluate results beyond a backtest, and keep risk controls in place before taking a position. Developing an edge in the stock market is an ongoing process: document decisions, review outcomes, and reassess whether the evidence still supports your approach.
AI tools can help bring structure to research by surfacing candidates and organizing opportunities. TickerAI combines AI-powered opportunity discovery and market scanning with smart watchlists, real-time alerts, curated swing trade setups, and long-term investment ideas. Use these as research inputs, then apply your own validation and risk rules.
Explore TickerAI stock opportunity discovery to find and organize ideas for independent evaluation. Build your process one hypothesis and one review at a time. Consistent, evidence-led decisions are a stronger foundation than chasing the next signal.
Frequently Asked Questions
What does developing an edge in the stock market mean?
Developing an edge in the stock market means building a repeatable process with evidence that its outcomes may be favorable under defined conditions. It starts with a testable hypothesis, clear entry and exit rules, and evaluation across multiple observations. A profitable trade or short winning streak isn’t enough. Consider costs, risk, and performance on data not used to create the idea, while recognizing that historical results can’t guarantee future outcomes.
Can an individual investor develop a trading edge?
Yes, an individual investor can research and test a specific process, but there’s no assurance it will produce an edge or keep working. Start with a narrow market behavior and define which stocks, timeframe, and rules you’ll examine. Use historical analysis to assess the hypothesis, then monitor how it holds up under realistic assumptions. Keep position sizing and loss limits in a written plan, and avoid risking capital on an untested idea.
How do you know if a trading strategy has a real edge?
You can’t know with certainty, but you can look for evidence that a strategy’s results are repeatable rather than limited to the data used to develop it. Define rules in advance, test on separate data, and account for costs, slippage, liquidity, and execution assumptions. Review expectancy, drawdowns, and consistency across time periods. If results depend on extensive parameter tuning or one favorable stretch, treat the evidence cautiously and investigate further.
Does a high win rate mean a strategy has an edge?
No. Win rate measures how often trades are profitable, not whether the overall strategy produces favorable results. A strategy with frequent small gains may still lose money if occasional losses are much larger. Assess win rate alongside average win and loss, expectancy, drawdown, and risk-adjusted performance. Also check whether results hold up after trading costs and on data outside the period used to shape the strategy. No single metric proves an edge.
Can AI give you an edge in the stock market?
AI can help scan markets and surface or organize stocks for independent research, but a signal alone doesn’t establish an edge. An alert is a prompt to examine a candidate, not a validated thesis or a trade decision. Compare it with your documented criteria, assess market context and liquidity, and apply your own risk controls. TickerAI offers opportunity discovery, watchlists and alerts, swing trade setups, and long-term investment ideas as research inputs.
How long does it take to develop a trading edge?
There’s no reliable fixed timeline. The time required depends on the hypothesis, the amount and quality of relevant data, how often valid setups occur, and whether results can be tested across different periods. Rushing to a conclusion from a small sample can mistake chance for evidence. Define review criteria in advance, keep testing assumptions realistic, and continue monitoring the process. Even a well-supported historical pattern may change as market conditions shift.


