

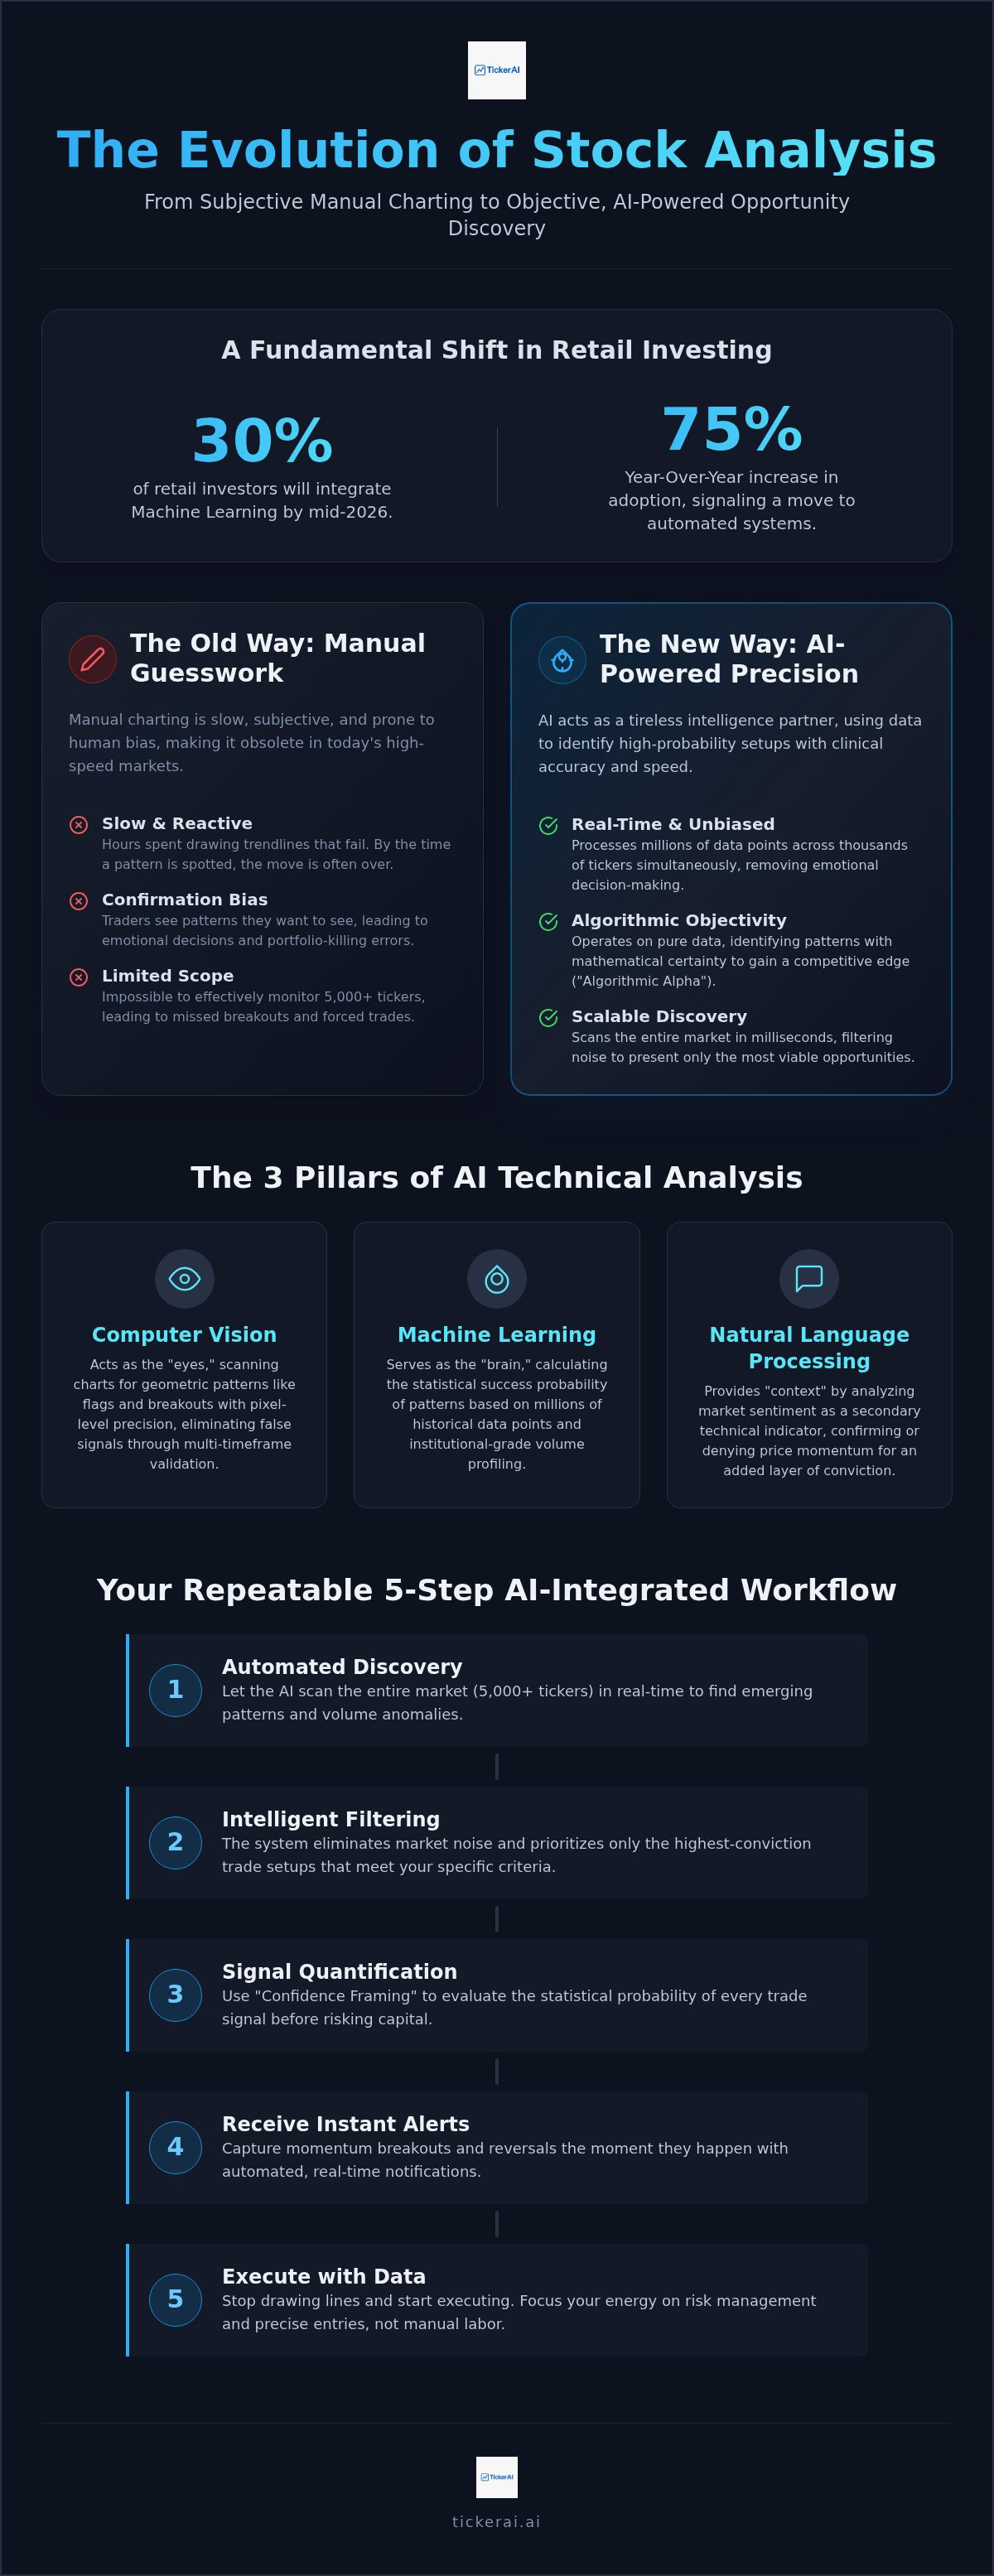
By mid-2026, nearly 30% of retail investors have integrated machine learning into their daily routines. This represents a 75% year-over-year increase in adoption. You likely recognize the fatigue of manual charting. You spend hours drawing trendlines that fail. You miss explosive breakouts because you weren't staring at the screen. Analysis paralysis from conflicting indicators is a silent portfolio killer.
It is time to evolve. This guide teaches you how to master AI for technical analysis of stocks to identify high-probability swing trade setups with clinical precision. You will learn to replace manual guesswork with an automated, data-driven workflow that saves hours every week. We are moving beyond simple charting into the era of the high-speed intelligence partner. The objective is clear: stop drawing lines and start executing on data.
We will examine the shift toward automated pattern recognition and unbiased entry signals. You will discover how to build a repeatable discovery process that filters market noise and prioritizes high-conviction setups. This is your roadmap to professional-grade execution in a fast-moving environment.
Key Takeaways
- Transition from subjective manual charting to objective, real-time machine learning discovery to eliminate human bias.
- Understand how computer vision and ML power AI for technical analysis of stocks to identify complex price patterns with clinical accuracy.
- Learn to evaluate technical tools using "Confidence Framing" to quantify the statistical probability of every trade signal before execution.
- Build a repeatable 5-step workflow that integrates automated alerts into your routine to capture momentum breakouts and reversals.
- Utilize TickerAI Full-Access and Pro tiers to streamline your discovery phase and focus exclusively on high-conviction swing trade setups.
The Evolution of Technical Analysis: From Manual Charts to AI-Driven Discovery
The Evolution of Technical Analysis has reached a critical inflection point. For decades, charting was a manual craft. Traders spent hours drawing trendlines, identifying support levels, and squinting at candlesticks. It was slow, subjective, and prone to human error. In the 2026 market, this approach is no longer sustainable. Today, AI for technical analysis of stocks utilizes machine learning to identify price patterns and volume anomalies with clinical speed. This isn't just a new tool; it's a fundamental shift from manual drawing to automated discovery.
We define AI technical analysis as the application of neural networks and computer vision to market data. While traditional analysis relies on a trader's memory and "gut feel," AI-driven discovery is objective and real-time. It processes millions of data points across thousands of tickers simultaneously. This creates what professionals call "Algorithmic Alpha." It's the competitive edge gained by seeing high-probability setups before the broader market can react. In a fast-moving environment, speed is the only currency that matters.
Why Manual Charting is Failing in 2026
Manual drawing is now obsolete for active participants. High-frequency algorithms execute in microseconds. If you're still drawing a flag pattern by hand, the move has likely already happened. Human inconsistency is your greatest liability. Two traders looking at the same chart often see different patterns based on their personal bias. This "confirmation bias" is the primary killer of retail portfolios; traders see what they want to see rather than what the data shows. Manual scanning is limited by time. You cannot effectively monitor 5,000+ tickers across the NYSE and NASDAQ. Stale data leads to missed breakouts and forced entries.
The Core Benefits of Algorithmic Objectivity
Algorithms don't have "favourite" stocks. They don't care about a company's brand or your previous trading losses. They operate with pure, data-driven objectivity. By leveraging AI for technical analysis of stocks, you remove the emotional weight of decision-making. The primary benefit is the ability to scale your research. AI can scan the entire market in milliseconds, identifying specific setups like cup-and-handle patterns or volume climaxes instantly. This allows you to function as a high-level decision-maker. You stop being a data entry clerk and start being a professional executor. You focus on risk management and entry precision while your AI intelligence partner handles the discovery. It's about working with a tireless scout that is always "on," filtering the noise to present only the most viable opportunities.
How AI Technical Analysis Works: Pattern Recognition and Quantitative Levels
Modern AI for technical analysis of stocks operates on three primary pillars: Computer Vision (CV), Machine Learning (ML), and Natural Language Processing (NLP). CV acts as the eyes, scanning charts for geometric patterns like flags, cups, and handles. ML serves as the brain, calculating the success probability of these patterns based on millions of historical data points. NLP provides the necessary context, treating sentiment as a secondary technical indicator that confirms or denies price momentum. This multi-layered approach allows AI to explain stock-price moves with a level of detail manual charting cannot match. It identifies why a level is holding, not just that it exists.
Computer Vision in Chart Pattern Recognition
Neural networks identify trendlines and breakouts with mathematical certainty. Unlike a human trader who might force a pattern to fit their bias, CV models require specific pixel-level criteria to trigger a signal. These systems use multi-timeframe validation to eliminate false breakouts. They ensure that a move on the 5-minute chart is supported by the 1-hour and daily trends before issuing an alert. In the 2026 environment, AI detects a momentum breakout by identifying a high-velocity price expansion accompanied by a 300% increase in relative volume and a breach of multi-month liquidity ceilings. This precision prevents traders from entering "stale" setups that lack institutional backing.
Quantitative Order Flow and Liquidity Zones
AI moves beyond lagging indicators like RSI and MACD. It focuses on institutional-grade volume profiling to identify where the "big money" is positioned. By analyzing the limit order book, algorithms detect "dark pool" activity and large institutional footprints that remain invisible to standard retail tools. This is the foundation of what is quantitative investing: using hard data to find liquidity zones where price is most likely to react. These systems map out supply and demand imbalances with clinical accuracy, providing clear targets for entry and exit.
Identifying these zones manually is a full-time job. Automated systems do it in real-time across the entire market. If you want to stop chasing and start anticipating, consider how AI-powered discovery can streamline your watchlist. It transforms the chaotic sea of tickers into a prioritized list of high-probability setups.
Evaluating AI Technical Tools: Accuracy, Speed, and Risk Discipline
Selecting AI for technical analysis of stocks requires a clinical framework. You aren't just looking for a software subscription; you're hiring a high-speed intelligence partner. To make an informed decision, categorize tools by their primary function: Discovery, Analysis, or Execution. A professional tool must provide "Confidence Framing." This means the system doesn't just issue a buy signal; it provides a statistical probability score based on historical backtesting and current market regime. If a tool treats every setup with equal weight, it isn't filtering noise, it's adding to it.
Speed to answer is the metric that separates hobbyist tools from professional platforms. In the 2026 market, the transition from "What about this ticker?" to a full trade setup must happen in seconds. This setup must include automated risk management. An entry signal is useless without a calculated stop-loss and a defined profit target. Your AI should automate the math of risk-to-reward ratios so you can focus on the final decision. High-speed intelligence is about reducing the time between discovery and execution without sacrificing discipline.
Discovery vs. Analysis: Knowing the Difference
Analysis tools help you study a stock you've already identified. They're reactive. Discovery tools find the stock for you by scanning the entire market for specific criteria. TickerAI focuses on "Opportunity Discovery" to solve the "where do I start?" problem. This is critical for swing traders who don't have the capacity to watch thousands of tickers simultaneously. You should choose a tool that matches your specific timeframe. Day traders require millisecond latency, while swing traders need broad discovery and high-conviction setups that can hold for several days.
The Professional Checklist for AI Trading Tools
Real-time alert latency is the most critical factor for managing 2026 volatility. Even a five-minute delay can turn a high-probability breakout into a low-reward chase. Look for platforms that offer "Smart Watchlists" organized by momentum profiles or thematic sectors. This structure prevents information overload and keeps your focus on the most active areas of the market. When you are evaluating an AI stock picking service, prioritize those that emphasize transparency in their discovery logic. You need to know why a stock was flagged to maintain confidence during temporary drawdowns. A repeatable workflow is built on trust in the underlying data.
Building a Systematic Trading Workflow with AI Insights
Integrating AI for technical analysis of stocks into your daily routine is the difference between a gambler and a professional. A tool without a system is just an expensive source of distraction. You need a modular workflow that moves from discovery to execution without hesitation. This process turns raw market data into actionable intelligence by following a logical, repeatable sequence. It ensures that every trade you take is backed by statistical probability rather than a fleeting impulse.
Your systematic workflow should follow these five clinical steps:
- Step 1: Define your Edge. AI requires a specific objective. Are you hunting for high-velocity momentum breakouts or mean-reversion value reversals?
- Step 2: Automate the Scout. Configure your scanners to monitor the entire market 24/7. Let the machine handle the "brute force" work of scanning 5,000+ tickers.
- Step 3: Validate with Quantitative Data. Never follow an alert blindly. Review the AI confidence score and ensure multi-timeframe alignment across daily and hourly charts.
- Step 4: Execute with Risk Discipline. Use AI-calculated stop-losses and position sizing. Your entry is only as good as your protection.
- Step 5: Review and Refine. Use historical win rates to optimize your scanner settings for the current market regime.
Step-by-Step: From Alert to Execution
Filtering market noise is your primary objective. Most market movements are random; you only care about the anomalies. High-conviction signals appear when price action, volume, and sentiment align perfectly. Smart Watchlists serve as your command center, organizing these anomalies by sector or setup type. This structure allows you to ignore the chaos of the broader market and focus on the 1% of tickers that actually matter. You can learn more about using AI to remove emotion from trading to ensure your execution remains clinical and detached from the result of any single trade.
Post-Trade Analysis: The AI Feedback Loop
The workflow doesn't end at the exit. Professional traders use AI to journal and review performance data with surgical precision. Review why certain setups succeeded while others failed. Was the failure due to the pattern or a shift in broader market liquidity? This feedback loop allows you to refine your scanners based on hard historical data. A repeatable workflow reduces psychological stress for traders by replacing emotional guesswork with a predictable, data-driven sequence. If you're ready to stop guessing, access our AI Stock Opportunity Discovery tools to start building your professional system.
TickerAI: Automating Your Stock Opportunity Discovery
In the 2026 market environment, data is abundant but clarity is scarce. TickerAI functions as your professional intelligence partner, designed for participants who have moved beyond manual charting and require a clinical edge. By leveraging AI for technical analysis of stocks, TickerAI identifies high-potential movements before they reach the mainstream. This isn't about providing more data; it's about providing the right data. It's a proactive scout that filters market noise into actionable intelligence. You stop being a researcher and start being a professional executor.
TickerAI operates with a sense of "innovative pragmatism." We value technology for the specific, tangible advantages it provides in terms of time-saving and clarity. Our platform acts as a sophisticated filter for a chaotic environment. It's a tireless, high-tech assistant that's always "on," scanning and detecting while you focus on high-level decision-making. The transition from identifying a problem (information overload) to presenting the solution (automated filtering) is seamless and persistent throughout the user experience.
Why TickerAI is the Choice for Systematic Traders
Systematic traders don't need more noise; they need high-conviction signals. TickerAI offers tiered access through its TickerAI Full-Access and TickerAI Pro subscriptions. These tiers provide actionable swing trade setups that have been filtered through rigorous algorithmic scanning. Unlike traditional tools that dump raw data onto your screen, our AI stock discovery platform prioritizes action-oriented movements. We focus on quality over volume. This ensures your mental capital is spent on execution rather than endless searching. Professional traders use these insights to build a repeatable workflow that saves hours every week. High-quality discovery is the foundation of Algorithmic Alpha.
The TickerAI Edge: Smart Watchlists and Real-Time Alerts
The 2026 sector rotation moves with unprecedented speed. TickerAI's Smart Watchlist & Alerts allow you to participate in thematic discovery with zero latency. Whether it's a sudden surge in energy storage or a breakout in quantum computing, the system detects the footprint immediately. It filters the chaos into a curated list of opportunities. Real-time alerts notify you of price and volume anomalies as they happen. This is the ultimate tool for AI for technical analysis of stocks, providing a high-speed intelligence partner that never sleeps. Don't wait for the breakout to appear on the news. Join TickerAI to automate your market discovery and start identifying high-probability setups with clinical precision today.
Master the Algorithmic Edge in 2026
Manual charting is a legacy process. Success in the 2026 market demands a definitive shift from subjective drawing to clinical, automated discovery. You've seen how AI for technical analysis of stocks removes confirmation bias and identifies high-probability setups across thousands of tickers in milliseconds. By leveraging computer vision and quantitative order flow, you move from reactive searching to proactive execution.
A repeatable system is your primary defense against market noise. It allows you to prioritize high-conviction signals with mathematical certainty. Your goal is to act as a high-level decision-maker while an intelligence partner handles the brute force of data analysis. TickerAI delivers the precision required for this fast-moving environment. With advanced AI anomaly detection and real-time swing trade alerts, you capture momentum before it's priced in. Our curated smart watchlists keep you focused on active sectors without information overload.
Start your AI-powered stock discovery with TickerAI and transition to a systematic, data-driven operation. The market moves fast. Your analysis should move faster.
Frequently Asked Questions
Is AI technical analysis better than traditional technical analysis?
AI technical analysis offers superior speed and objectivity compared to traditional methods. While manual charting relies on subjective interpretation, AI uses machine learning to identify price patterns with clinical precision. It processes thousands of tickers simultaneously, a task impossible for a human trader. This transition from manual work to automated discovery allows you to focus on execution. It eliminates the confirmation bias that often leads to retail portfolio losses.
Can AI really predict stock price movements?
AI identifies high-probability setups based on historical data and real-time anomalies. It doesn't predict the future with absolute certainty; instead, it quantifies the statistical likelihood of a movement. By utilizing AI for technical analysis of stocks, traders can detect momentum shifts before they become obvious to the broader market. This data-driven approach focuses on finding a repeatable edge. It replaces gut feelings with calculated risk to reward ratios.
Do I need to know how to code to use AI for technical analysis?
You don't need coding skills to leverage professional AI tools in 2026. Most advanced platforms provide intuitive interfaces and Smart Watchlists that handle the algorithmic heavy lifting for you. You simply define your trading criteria, such as momentum breakouts or value reversals, and the AI acts as your proactive scout. This accessibility allows serious participants to focus on decision-making. You spend your time executing trades rather than writing scripts.
What is the best AI tool for finding swing trade setups in 2026?
TickerAI is the premier choice for traders seeking actionable swing trade setups. The platform specializes in automated stock opportunity discovery through its Full-Access and Pro tiers. It filters market noise to present only the most high-conviction signals. This focus on discovery rather than just raw data volume gives you a distinct advantage. It's designed for professionals who need a reliable intelligence partner to scan the NYSE and NASDAQ in real-time.
How much does an AI stock alert subscription usually cost?
Subscription costs for AI stock tools vary significantly across the industry. In 2026, basic buy/sell signals from some providers start as low as $5 per month, while comprehensive expert tiers can reach $250 per month. Annual billing for established analytical platforms typically ranges between $54 and $122 per month depending on the depth of real-time data required. You should choose a tier that aligns with your specific trading frequency and technical requirements.
Does TickerAI provide personal financial advice?
TickerAI does not provide personal financial advisory or custom trading coaching. The platform is strictly a tool for discovery and alerts. It generates data-driven insights, swing trade setups, and long-term investment ideas based on automated analysis. Users are responsible for their own brokerage execution and risk management decisions. We recommend consulting a certified financial advisor for personalized investment strategies. Our mission is to provide high-speed intelligence, not individual brokerage services.
Can AI technical analysis help me remove emotion from my trading?
Automated discovery is the most effective way to remove emotional attachment from your trading routine. Algorithms operate with pure objectivity; they don't have favorite stocks or feel the sting of previous losses. By following AI for technical analysis of stocks, you execute based on clinical data points rather than fear or greed. This systematic discipline ensures you stick to your predefined edge. It transforms trading from a high-stress gamble into a calculated professional process.
What are "derived levels" in AI stock analysis?
Derived levels are quantitative support and resistance zones calculated by AI using institutional order flow and liquidity data. Unlike traditional levels drawn by hand, these are mathematically verified points where big money is likely positioned. AI identifies dark pool activity and supply-demand imbalances that are invisible on standard charts. These levels provide a more accurate roadmap for entry and exit. They represent the actual mechanics of the market rather than subjective geometric theories.


