

Manual stock research is a relic of a slower era. By the time you've finished scrubbing a single 10-K, the algorithmic market has already identified the opportunity and moved the price. You're likely exhausted by fragmented data sources and the analysis paralysis that leads to missed entries. It's frustrating to watch high-potential setups pass you by because your evaluation process can't keep pace with the 2026 market velocity. This guide changes that. You'll learn how to master quantitative stock analysis methods to replace emotional bias with clinical, data-backed precision.
We're moving beyond the gut feeling and into a world of high-speed algorithmic evaluation. Whether you're tracking the impact of the current 6.75% prime interest rate or monitoring SEC shifts in crypto assets, your research needs to be scalable and objective. We'll break down a streamlined evaluation workflow that allows you to scan hundreds of tickers simultaneously. This isn't about working harder. It's about deploying a tireless digital scout to handle the filtering. By the end of this professional guide, you'll have the framework to build trade setups with total confidence in your underlying data.
Key Takeaways
- Transition from manual, lagged research to high-speed algorithmic evaluation to maintain a competitive edge in the 2026 market.
- Learn to synthesize fundamental health with technical momentum for a multi-dimensional view of every potential trade setup.
- Deploy professional quantitative stock analysis methods to scale your research across hundreds of tickers with clinical precision and zero emotional bias.
- Execute a structured 5-step framework to define your market universe and filter for high-potential momentum or relative strength setups.
- Leverage AI-powered discovery tools to act as a tireless scout, filtering through market noise to prioritize high-conviction signals.
The Evolution of Stock Analysis: Why Manual Research Fails in 2026
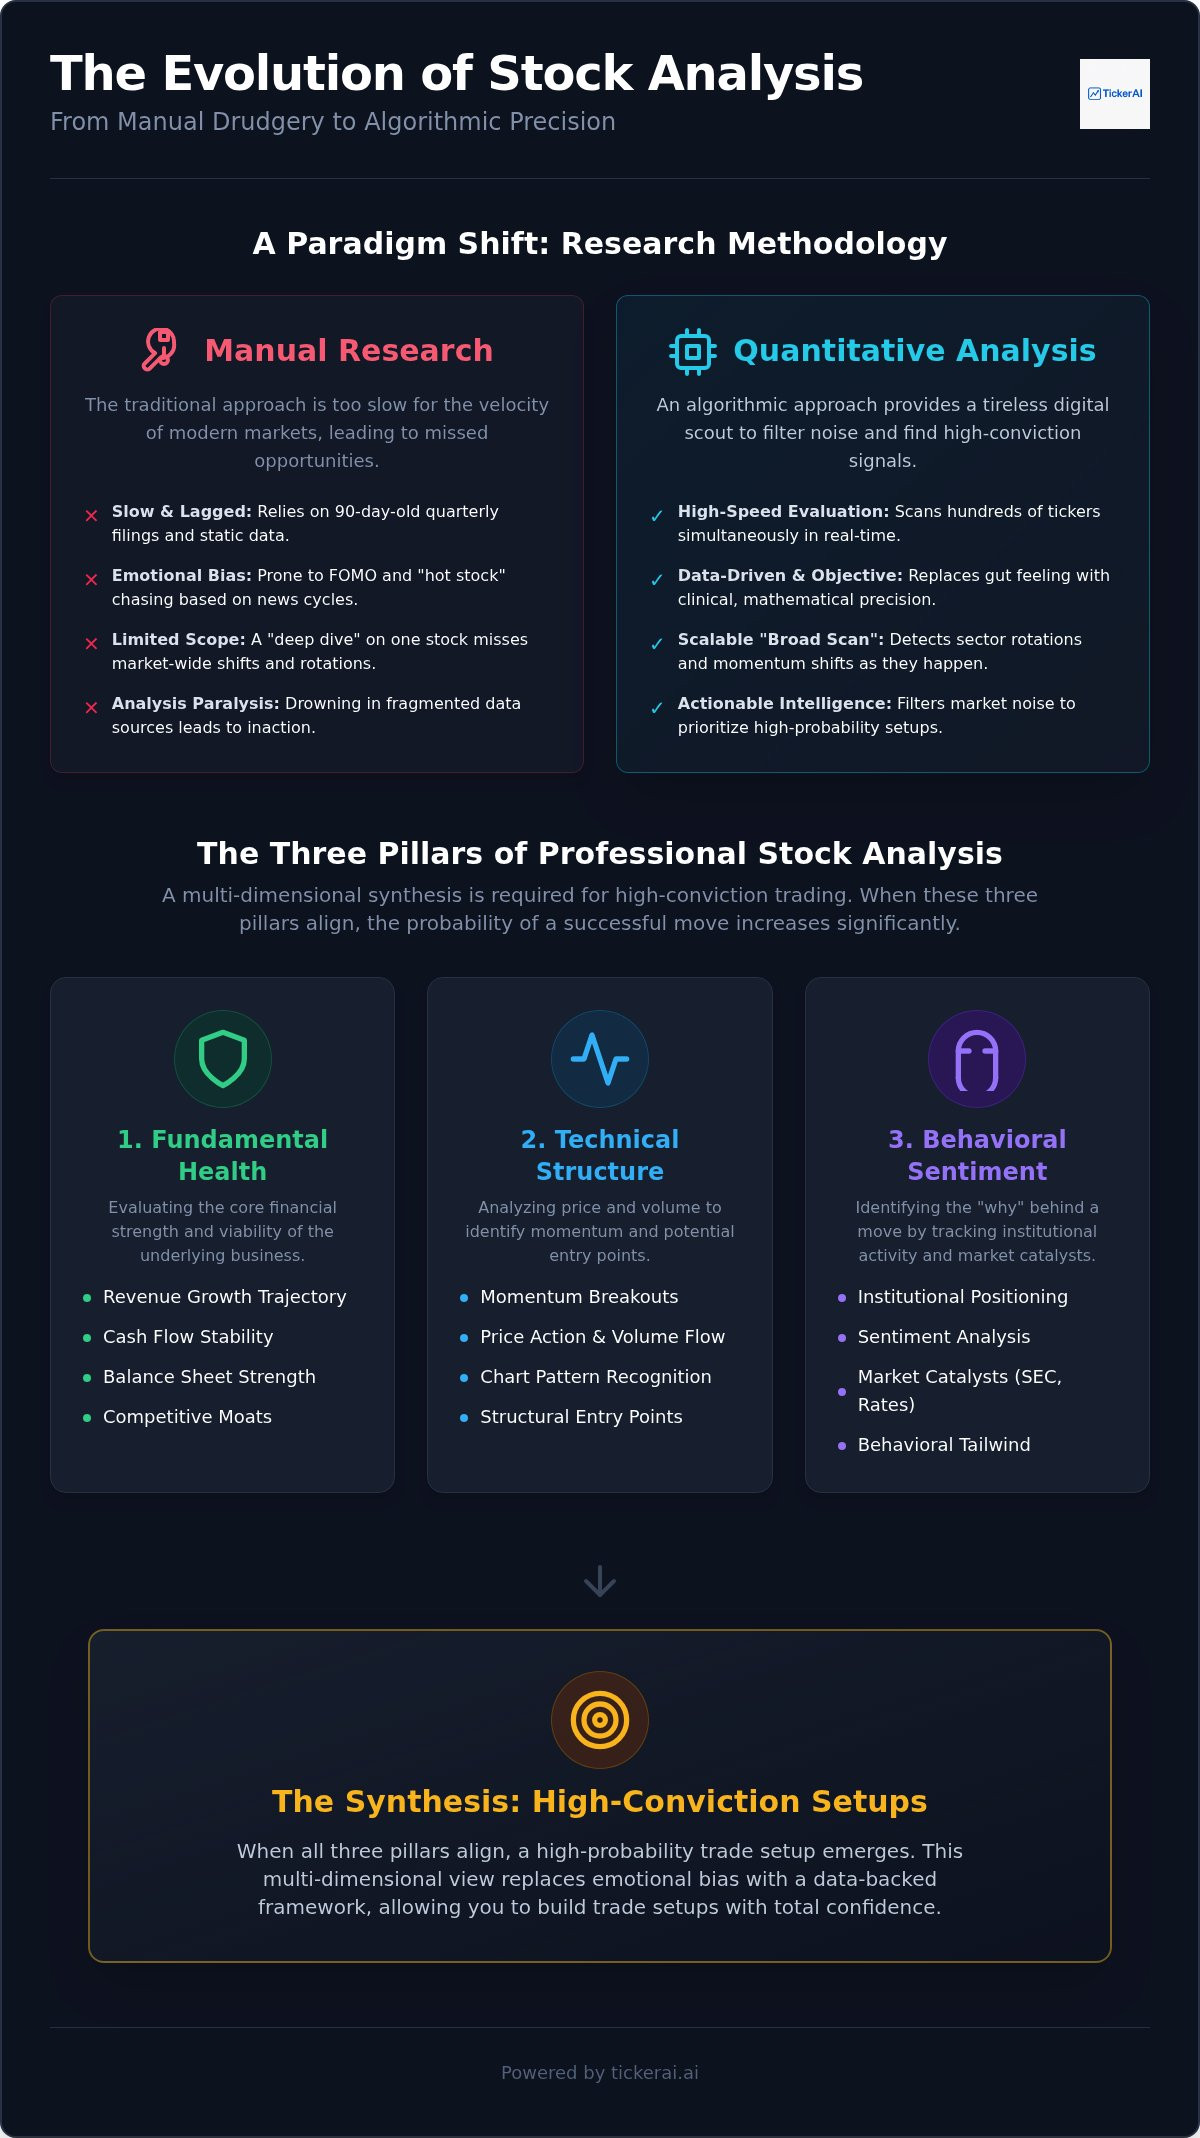
The 2026 market environment doesn't reward the diligent researcher; it rewards the efficient one. Modern stock analysis is no longer about who can read the most annual reports. It's the intersection of data, speed, and logic. Traditional manual research is inherently lagged. By the time a human analyst updates a spreadsheet, the high-conviction signal has likely already been priced in by algorithmic participants. Systematic evaluation is the process of applying rule-based filters to raw market data.
This approach moves beyond the "Deep Dive" into a "Broad Scan" mentality. Utilizing professional Quantitative Analysis in Finance provides a foundational framework for this shift. It replaces the noise of 24-hour news cycles with actionable intelligence. Instead of drowning in information overload, successful traders use quantitative stock analysis methods to isolate tickers with the highest probability of movement. It's a calculated transition from being a reactive reader to a proactive scout.
The Lag Factor in Traditional Analysis
Quarterly filings are snapshots of the past. For active swing traders, relying solely on these documents is a strategic error. In a market where the prime interest rate can shift and trigger immediate sector rotations, 90-day-old data is functionally useless. Real-time momentum discovery requires monitoring price action and volume flow as they happen. You must move from asking "What happened last quarter?" to "What is happening right now?" High-speed filtering allows you to detect these shifts before the broader retail market catches on. Speed is the only moat that remains in a volatile environment.
Removing Emotional Bias from the Equation
Human psychology is the greatest threat to a trading account. Cognitive shortcuts often lead to "hot stock" chasing and destructive FOMO. These emotional biases cloud objective evaluation. Adopting quantitative stock analysis methods ensures that every ticker is viewed through a clinical, data-driven lens. By using AI to remove emotion from trading, you establish a systematic discipline that prioritizes logic over gut feelings. This transition turns a chaotic decision-making process into a repeatable, professional workflow. It's about maintaining a clinical perspective on every ticker in your universe, ensuring that execution is based on math rather than hope.
The Three Pillars of Professional Stock Analysis
High-conviction trading in 2026 requires more than a single technical indicator or a solitary financial ratio. It demands a multi-dimensional synthesis. Professional traders rely on three core pillars to evaluate every ticker: fundamental health, technical structure, and behavioral sentiment. When these three dimensions align, the probability of a successful move increases significantly. Applying modern quantitative stock analysis methods allows for the simultaneous evaluation of these pillars across thousands of equities. This systematic approach mirrors the evolution of quantitative trading, moving from simple math to complex, multi-factor modeling.
The behavioral pillar acts as the final filter. It identifies the "why" behind an institutional move by analyzing sentiment and catalysts. Whether it's a shift in the 6.75% prime interest rate or a new SEC regulatory framework for digital assets, catalysts provide the fuel for price action. Without a catalyst, even the best technical setup can stagnate. A professional workflow integrates all three pillars to ensure that every trade has a foundational reason, a structural entry, and a behavioral tailwind.
Fundamental Health: Beyond the Balance Sheet
Traditional fundamental analysis often stops at stagnant ratios. In a high-speed market, you need to evaluate revenue growth trajectories and cash flow stability in real time. AI-driven tools now scan SEC filings to spot subtle anomalies or shifts in institutional positioning that manual reading would miss. Competitive moats are no longer permanent. They shift rapidly as technology evolves. You must identify companies with the balance sheet strength to survive the current interest rate environment while maintaining enough capital for innovation. Monitoring these metrics at scale is the only way to separate temporary runners from sustainable leaders.
Technical Structure: Identifying Momentum Breakouts
The chart is the truth. While fundamentals tell you what to buy, technicals tell you when. You're looking for institutional footprints in price action and volume profiles. Large-scale accumulation often precedes a major breakout, and these patterns are visible if you know where to look. Integrating automated stock market analysis allows you to find these setups across the entire S&P 500 or Nasdaq 100 in seconds. It eliminates the need to click through hundreds of charts manually.
A high-conviction setup occurs when a fundamentally sound company breaks out of a consolidated technical base on high relative volume. This convergence suggests that institutional money is moving. To catch these moves before they mature, you need a system that scans for these specific criteria 24/7. You can start building your professional watchlist to monitor these pillars in real time. By combining these three dimensions, you move from guessing to executing with clinical precision.
Quantitative Stock Analysis Methods vs. Fundamental Research
Traditional fundamental research is a "Deep Dive." It requires hours of manual scrutiny into a single company's management, product pipeline, and competitive moat. While valuable, this slow-motion approach is insufficient for the 2026 market. In contrast, quantitative stock analysis methods utilize a "Broad Scan" philosophy. Instead of analyzing one company deeply, you evaluate thousands of tickers simultaneously against specific mathematical benchmarks. This transition is essential. Understanding what is quantitative investing reveals a systematic path to discovery that eliminates the lag of human-led research.
Retail investors no longer operate at a disadvantage. Institutional-grade quantitative tools are now accessible to the individual trader. The most effective strategy involves balancing both worlds. Use high-speed quant filters to narrow a universe of 8,000 stocks down to a manageable shortlist of five high-conviction candidates. This allows you to focus your fundamental verification only on the targets with the highest mathematical probability of success. It's a workflow designed for maximum efficiency.
The Power of Algorithmic Filtering
Algorithms execute mathematical criteria with zero fatigue. They scan for specific RSI levels, volume surges, or moving average crossovers across every major index instantly. This speed allows you to detect momentum breakouts before they hit mainstream headlines or retail forums. A rule-based entry removes the "gut feeling" that leads to hesitation. If the stock meets the criteria, it enters the watchlist. If it doesn't, it's ignored. This clinical filtering ensures you only spend time on setups that already show institutional momentum.
Identifying 'Smart Money' Flow
Alpha is found by following institutional footprints. Quantitative data allows you to track where the "Smart Money" is moving in real time. By evaluating dark pool activity and unusual option flow, you gain a lead indicator of institutional intent. These large-scale participants often move before the public price action reflects their positions. Following these footprints is the highest-probability strategy for retail alpha. It turns the market into a transparent map of capital flow rather than a chaotic environment of random price swings.
A 5-Step Framework for Rapid Market Evaluation
Theory alone doesn't generate alpha. You need a repeatable workflow to convert raw data into executable trades. This 5-step framework streamlines your evaluation process, moving from thousands of tickers to a high-conviction shortlist in minutes. It relies on quantitative stock analysis methods to handle the heavy lifting while you focus on final decision-making. Speed is your primary advantage. Efficiency is your secondary one. By standardizing your quantitative stock analysis methods, you remove the inconsistency of discretionary trading.
- Step 1: Define Your Universe. Filter by sector, market cap, and liquidity. Ensure every ticker meets minimum volume requirements, such as 1 million shares per day, to avoid slippage.
- Step 2: Apply Quantitative Scans. Look for momentum or relative strength against the S&P 500. Mathematical filters identify leaders before the retail crowd notices.
- Step 3: Verify Catalysts. Check for upcoming earnings, regulatory news, or product launches. A technical move needs a fundamental "why" to sustain momentum.
- Step 4: Analyze Technical Structure. Map out support and resistance. Calculate your risk/reward ratio to ensure every setup offers at least a 3:1 potential.
- Step 5: Final Sanity Check. Size your position based on current volatility. The 6.75% prime interest rate continues to influence sector rotations, so adjust your exposure accordingly.
Step 1 & 2: Automating the Discovery Phase
Manual scanning is a waste of human intelligence. You should use an AI stock discovery platform to generate your initial shortlist. Set specific criteria for swing trade setups, such as RSI crossovers or sudden volume spikes relative to the 20-day average. Automated filtering eliminates laggards instantly. It saves hours of research time by ignoring stocks that don't meet your mathematical threshold. This allows you to focus only on the top 1% of opportunities that show institutional footprint.
Step 3 & 4: Validating the Opportunity
Breakouts are more powerful when they align with broader market themes. You can increase your win rate by finding thematic investment opportunities with AI. This process identifies if a ticker is part of a larger institutional rotation into specific sectors. Once the theme is confirmed, visualize support and resistance levels to define your 'Stop Loss' and 'Take Profit' zones. The catalyst provides the fuel, but the technical structure provides the timing. Execution happens only when the 'Why' aligns perfectly with the 'When.'
Precision execution requires the right tools to maintain your edge. You can access real-time AI discovery tools to begin automating this framework today. Stop guessing and start scanning with professional speed.
Scaling Your Edge: Automated Discovery with TickerAI
TickerAI acts as your tireless, 24/7 market scout across all major indices. It doesn't sleep. It doesn't get fatigued. It continuously applies quantitative stock analysis methods to the tape while you focus on high-level strategy. This automation allows you to transition from manual evaluation to interpreting AI stock signals with clinical precision. Instead of searching for the signal, you spend your time validating it. You're moving from a data collector to a decision maker.
Smart Watchlists provide the organizational structure needed to manage high-conviction ideas by theme. Whether you're tracking AI infrastructure or energy sector rotations, these watchlists act as the bridge between discovery and execution. They ensure you aren't just finding trades, but managing them within a coherent portfolio strategy. Understanding how to compare platforms is critical for long-term success. Evaluating an AI stock picking service is the final step in modernizing your workflow for the 2026 market. It's about finding a partner that matches your logic and speed requirements.
TickerAI Full-Access vs. Pro: Choosing Your Logic
The choice between subscription tiers depends on your required depth and speed. TickerAI Pro offers robust scanning and quantitative stock analysis methods for the serious trader. TickerAI Full-Access provides the highest velocity of real-time market alerts and curated swing setups. In a 2026 environment defined by the 6.75% prime interest rate and rapid SEC regulatory shifts, latency is a risk. Full-Access eliminates this risk by delivering intelligence the moment it's detected. Curated setups solve the "blank page" problem. You start your day with a list of mathematically sound candidates rather than a blank screen.
Building a Repeatable Workflow
Consistency is the differentiator between a hobbyist and a professional. Integrate TickerAI alerts into your daily trading plan to ensure you never miss a verified setup. Use the platform to maintain a consistent watchlist of thematic plays. This ensures your capital is always positioned in the strongest sectors, regardless of broader market volatility. Logic-based discovery leads to logic-based profits. It's time to stop wasting hours on manual data scrubbing and start executing with precision.
The market waits for no one. Modernize your research process with TickerAI Full-Access and deploy a professional scout today.
Deploy Your Algorithmic Edge
The 2026 market rewards speed and systematic logic. Manual research is a liability in an environment driven by high-frequency institutional moves and shifting interest rates. You now have the framework to master quantitative stock analysis methods and replace emotional bias with data-driven precision. By synthesizing the three pillars of analysis into a repeatable 5-step workflow, you ensure every trade setup is structurally and fundamentally sound. It's a transition from reactive guessing to proactive execution.
Scaling this edge requires a tireless partner that scans while you decide. TickerAI provides the AI-powered real-time discovery and curated swing trade setups needed to stay ahead of the curve. Stop scrubbing data manually and start executing with clinical authority. Don't let information overload lead to missed entries or poor position sizing. High-speed intelligence is the only moat that remains in a volatile market.
Join TickerAI to Discover High-Potential Stock Setups Today and leverage data-driven market alerts to dominate your watchlist. Your transition to professional-grade evaluation starts now. The tools are ready; the execution is yours.
Frequently Asked Questions
What are the most important financial ratios for quantitative stock analysis in 2026?
In 2026, the most critical ratios focus on liquidity and efficiency relative to high interest rates. You should prioritize the Debt-to-Equity ratio to ensure solvency in a 6.75% prime rate environment. Additionally, monitoring Operating Cash Flow growth and Relative Strength Index (RSI) allows you to identify momentum. These quantitative stock analysis methods ensure you're filtering for companies with both financial health and technical momentum before committing capital.
How does AI help in evaluating a company’s future potential?
AI identifies future potential by detecting non-linear patterns in massive datasets that human analysts miss. It scans thousands of SEC filings to spot institutional positioning and shifts in revenue trajectories. By analyzing thematic links across sectors, AI acts as a proactive scout for emerging market moves. This allows you to move beyond stagnant quarterly reports and focus on real-time indicators of institutional intent and sector rotation.
Can I evaluate a company for swing trading using only technical analysis?
While possible, relying exclusively on technical analysis for swing trading increases the risk of being caught in a low-conviction trap. Technicals provide the entry timing, but fundamental health explains why the stock is moving. A clinical approach requires verifying that a technical breakout is supported by a catalyst or strong balance sheet. Combining these pillars ensures that your trade setups have both structural support and fundamental reason.
What is the difference between qualitative and quantitative evaluation?
Qualitative evaluation involves subjective judgment on management quality, brand value, and competitive moats. It's a slow "Deep Dive" into a single ticker. Quantitative evaluation uses mathematical filters to perform a "Broad Scan" across the entire market. Professional quantitative stock analysis methods prioritize speed and logic, allowing you to ignore emotional bias and focus on objective data points that suggest high-probability institutional accumulation and capital flow.
How much time should I spend evaluating a single stock setup?
Your evaluation time should be split between automated discovery and manual validation. The filtering phase is now instant through AI-powered platforms. Once a ticker hits your shortlist, spend 10 to 15 minutes verifying the specific catalyst and technical risk/reward ratio. This streamlined workflow allows you to scale your research across hundreds of tickers without falling into analysis paralysis or missing high-speed market entries during volatile sessions.
How do I identify 'Smart Money' or institutional activity during evaluation?
Institutional activity is visible through footprints in volume profiles and price action. You should monitor for high relative volume spikes that suggest large-scale accumulation. Additionally, tracking dark pool activity and unusual options flow provides a lead indicator of institutional intent. These data points reveal where the "Smart Money" is positioning itself before the broader retail market reacts to the news or a confirmed technical breakout.
What are the risks of relying solely on automated stock alerts?
The primary risk of relying solely on automated alerts is the lack of contextual validation. An alert is a signal of potential, not an immediate mandate to buy. Without checking for upcoming earnings or broader market themes, you may enter a setup that lacks a sustaining catalyst. Use alerts as a sophisticated filter to prioritize your attention, but always perform a final sanity check on position sizing.
Is fundamental analysis still relevant for short-term swing traders?
Fundamental analysis remains a critical safety filter for short-term traders. It prevents you from buying technically perfect charts that belong to companies with deteriorating cash flow or insolvency risks. In the 2026 market, verifying a company's fundamental health ensures that a technical breakout has the underlying strength to survive intraday volatility. It turns a speculative gamble into a professional, high-conviction trade setup with data-backed support.


