

Why do most retail traders buy the top while institutions are already taking profits? The reality is that price action isn't random. It's the result of quantifiable accumulation. Mastering how to find breakout stocks requires moving beyond manual chart scrolling and gut feelings. You've likely felt the sting of missing a major move because your screening process was too slow. Or perhaps you've been "faked out" by a false signal that evaporated your capital. Information overload creates paralysis. It's time to replace guesswork with clinical precision.
This guide delivers a systematic framework for identifying high-potential breakouts before the market moves. You'll learn to leverage technical indicators and AI-driven intelligence to filter the noise. We provide a clear checklist for breakout criteria and strategies to slash your research time. This approach ensures earlier entry points into momentum trends. From detecting volume anomalies to utilizing automated discovery tools, we'll show you how to turn market volatility into a calculated professional advantage.
Key Takeaways
- Understand the mechanics of supply and demand to recognize when a stock is primed to move beyond key resistance levels.
- Master the use of Relative Strength and volume expansion to understand how to find breakout stocks with technical precision.
- Identify institutional accumulation by tracking unusual option activity and "Smart Money" footprints; detect these signals before the price surge.
- Build a streamlined trading workflow that uses automated scanning to reduce research time and eliminate information overload.
- Leverage AI-driven intelligence to monitor thousands of tickers in real-time for high-speed anomaly detection and earlier entry points.
What is a Breakout Stock? Defining High-Momentum Opportunities
A Breakout (technical analysis) occurs when a security's price moves above a defined resistance level on significantly increased volume. This isn't just a chart pattern. It's a structural shift in market conviction. In the high-speed 2026 market environment, traditional "Stage Analysis" is often too slow to be effective. Algorithmic Alpha now requires identifying these shifts in real-time as institutional capital rotates into new sectors. Mastering how to find breakout stocks in a high-frequency environment demands a move away from lagging indicators toward real-time liquidity analysis.
Every breakout represents a transition from supply-dominance to demand-dominance. When a stock clears a resistance level, the "ceiling" of sell orders is exhausted. Continuation breakouts happen within established trends, signaling a second wind for momentum. Reversal breakouts mark the end of a downtrend, signaling a fundamental shift in sentiment. Understanding these regimes is the first step in learning how to find breakout stocks that actually follow through rather than collapsing back into the range.
The Mechanics of Price Resistance
Resistance levels function as psychological barriers. They often form at previous price peaks or round numbers where investors look to exit positions. When price breaches these levels, it triggers a cascade of buy orders. Trapped shorts are forced to cover, adding fuel to the upward move. This creates a feedback loop of rapid price acceleration that defines a true high-momentum opportunity. Resistance is a concentration of sell orders.
Why Breakouts Fail: The "Fakeout" Trap
Not every breach of resistance is a buying opportunity. "Fakeouts" occur when price moves above a level on low volume, indicating a lack of institutional backing. No volume. No follow-through. That's the hallmark of a trap. Chasing a move that is already 5% or 10% extended increases your risk of buying the "blow-off top." To mitigate this, traders must use a systematic approach to stock investing that filters for volume confirmation and relative strength. High-frequency trading has compressed the time between a breakout and a potential retracement. If the volume isn't 2x or 3x the daily average, the probability of a reversal remains high. Precision execution relies on detecting these anomalies before the retail crowd reacts.
Technical Indicators: How to Screen for Potential Breakout Stocks
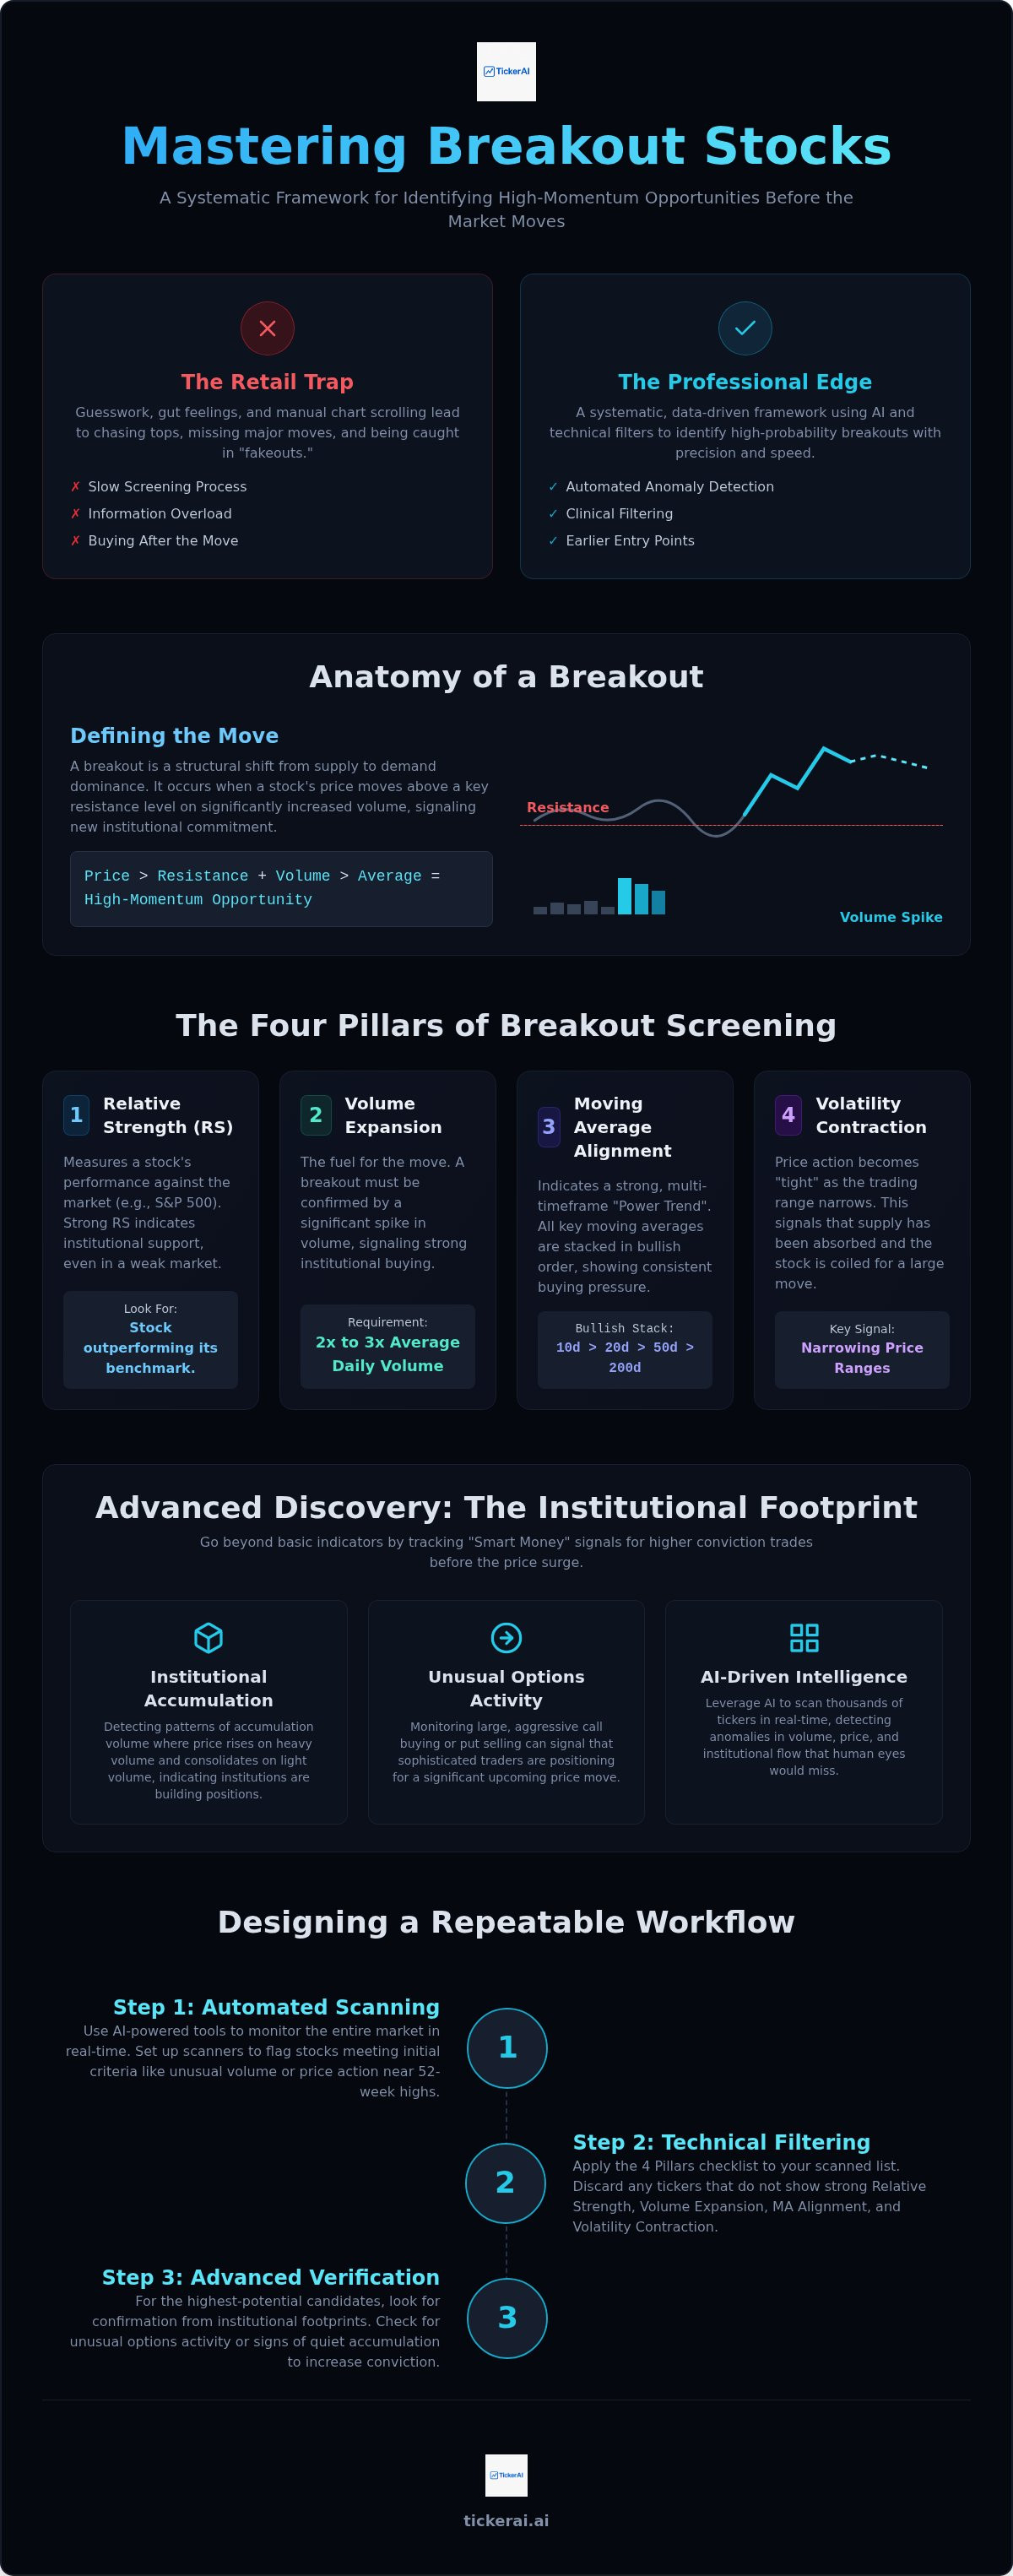
Screening is the process of elimination. To understand how to find breakout stocks, you must filter for four primary technical pillars: Relative Strength, volume expansion, moving average alignment, and volatility contraction. These indicators act as a high-speed filter, removing the noise of stagnant tickers and focusing your capital on assets with the highest probability of immediate movement.
Relative Strength (RS) measures a stock's performance against a benchmark, typically the S&P 500. It's the ultimate filter for professional traders. If the broader market is correcting while a specific ticker holds its ground or moves higher, institutional support is clearly present. Volume expansion provides the necessary fuel for the move. A legitimate breakout requires at least 2x to 3x the average daily volume to signal institutional commitment. Without this spike, the move is likely a retail-driven trap that will quickly reverse. Utilizing real-time market anomaly detection can help you spot these contractions before the price explodes.
The "Power Trend" setup involves moving average alignment. Look for a stack where the 10-day MA is above the 20-day, which is above the 50-day, all riding above the 200-day. This alignment indicates a strong, multi-timeframe trend where every dip is being bought. Finally, volatility contraction identifies "tightness" in price action. When price ranges narrow significantly, it suggests supply has been absorbed and the stock is ready for a directional move. A breakout from a tight base has a much higher probability of sustained momentum than one from a wide, erratic base.
The Volume-Price Relationship
Volume precedes price. In high-conviction moves, price follows volume. Distinguishing between "accumulation volume" and "exhaustion volume" is critical for trend health. Accumulation occurs when price rises on heavy volume and consolidates on light volume, indicating that institutions are holding their positions. Conversely, exhaustion volume appears as a vertical spike after an extended move, often signaling the end of the trend. On-Balance Volume (OBV) acts as a running tally of this pressure. If OBV is trending higher while price is flat, the stock is being systematically accumulated.
Screening for 52-Week Highs
Stocks hitting 52-week highs have zero overhead supply. This is the "laundry chute" effect. Every current holder is in a profit position, which eliminates the urge to sell at breakeven levels. Professional traders filter for "tightness" just below these highs. A stock drifting sideways for 2-3 weeks before breaching its 52-week peak often results in a more explosive move than a "V-shaped" recovery. Manually scanning 10,000 tickers for these patterns is inefficient. Professional workflows rely on quantitative stock analysis tools to isolate these setups instantly. This allows you to focus on execution rather than data entry.
Advanced Discovery: Spotting Breakouts with Institutional Data
Price and volume are lagging consequences of institutional positioning. To master how to find breakout stocks, you must track the "Smart Money" before the retail crowd arrives. Large hedge funds and pension funds don't buy all at once. They accumulate positions over days or weeks, leaving distinct "footprints" in the tape. Tracking these entries provides a leading edge that traditional chart patterns often miss. When you see massive blocks of shares being bought without a corresponding spike in price, you're likely witnessing dark pool accumulation. This hidden demand creates a coiled spring effect once the stock finally hits the public exchanges.
Unusual Option Activity (UOA) serves as another critical leading indicator. Spikes in aggressive call buying often precede significant price breakouts. This activity suggests that informed participants are positioning for a near-term catalyst. Combining UOA with technical setups increases the probability of follow-through. Sentiment analysis further refines this by quantifying social and news buzz. The goal is to identify "hidden" trades where institutional accumulation is high but public awareness remains low. Crowded trades often lead to "fakeouts," while hidden moves offer the highest risk-reward ratios.
Identifying Institutional Accumulation
Reading the tape reveals the conviction behind a move. Institutions provide "Big Money" support during minor price pullbacks, preventing the stock from collapsing back into its range. If a stock holds its 20-day moving average on low volume after a breakout, it's a sign that the original buyers aren't selling. Understanding these nuances is essential for long-term consistency. Utilizing tools for interpreting AI stock signals clarifies institutional intent by filtering out high-frequency noise and highlighting sustained accumulation patterns.
Catalyst Discovery and Thematic Trends
Breakouts rarely happen in a vacuum. They're often triggered by catalysts such as earnings beats, FDA approvals, or specific SEC filings. Scanning for sector-wide breakouts allows you to identify thematic trends early. When the leaders in a group like AI or Green Energy begin to move, the laggards often follow. You can use thematic investment opportunities to locate high-quality stocks that haven't yet breached resistance but share the same fundamental drivers as the leaders. Automating the tracking of upcoming market events ensures you're never caught off guard when a catalyst ignites a move. This proactive approach is how to find breakout stocks with institutional precision.
Designing a Repeatable Breakout Trading Workflow
Professional consistency is the product of a rigid protocol. Most retail participants fail because they approach the market with reactivity; they chase green candles after the move has already begun. A professional workflow reverses this. It focuses on preparation. Mastering how to find breakout stocks requires a four-step cycle that prioritizes high-conviction setups while minimizing manual screen time. Consistency isn't a trait; it's a protocol.
- Step 1: Automated Scanning. Configure your system to detect volatility contraction and volume spikes daily. You're looking for "quiet" price action followed by an influx of capital.
- Step 2: Multi-Factor Filtering. Cross-reference your scan results with relative strength scores and institutional footprints. If the "Smart Money" isn't present, the setup is discarded.
- Step 3: Trigger-Based Alerts. Set price alerts at key resistance levels. This eliminates the need for constant monitoring and prevents emotional "anticipatory" entries.
- Step 4: Systematic Execution. Enter only when the trigger is hit. Maintain a minimum 3:1 risk-to-reward ratio to ensure long-term profitability even with a 40% win rate.
By automating the discovery phase, you transform from a reactive observer into a proactive scout. You can automate your breakout discovery to ensure you never miss a high-momentum move again. This systematic approach allows you to scale your trading without increasing your workload. It's about working smarter, not longer.
Optimizing Your Smart Watchlist
Your watchlist is your inventory. It must be managed with clinical precision. Categorize potential trades into two tiers: "Active" for stocks within 2% of their trigger price and "Developmental" for those still forming a base. Pruning is mandatory. If a stock's technical thesis breaks, remove it immediately. Maintaining a lean, high-signal list is essential for removing emotion from trading and ensuring your focus remains on the highest-quality opportunities. Don't fall in love with a ticker; fall in love with the setup.
Risk Management for Breakout Traders
Execution without risk management is gambling. For breakout trades, the most effective stop-loss level is often the low of the breakout candle. If the price returns to this level, the breakout has failed. Use Average True Range (ATR) to size your positions; this ensures that more volatile stocks don't carry disproportionate risk in your portfolio. Professional traders never risk more than 1% of their total account capital on a single trade. This discipline ensures that a string of "fakeouts" doesn't result in catastrophic drawdown. Protecting your capital is the first step toward growing it.
TickerAI: Automating High-Potential Breakout Discovery
Manual charting is a bottleneck in a high-frequency environment. In the current market, speed is the only sustainable edge. TickerAI functions as a tireless, high-tech assistant that scans over 10,000 tickers in real-time. It detects the structural shifts discussed earlier without the fatigue or bias of human analysis. This is how to find breakout stocks with institutional speed. Our algorithms prioritize data-driven insights over subjective chart interpretation. It's about clinical precision and rapid execution.
The TickerAI Pro subscription provides real-time alerts that hit your device before the retail crowd can react. By the time a move appears on a standard, lagging scanner, the entry point is often already extended. TickerAI identifies the early-stage accumulation and volume anomalies that precede the surge. Smart Watchlists then organize these opportunities by theme, allowing you to monitor entire sectors with a single glance. This systematic discovery beats manual charting because it filters for quality at a scale no human can match.
AI-Powered Swing Trade Setups
TickerAI doesn't just look at price action. Every alert is a synthesis of technical indicators, fundamental health, and real-time sentiment data. This multi-layered filtering ensures that you only receive high-conviction entry points. If you're comparing tools, our swing trade setup finder guide explains how to evaluate these algorithmic systems for maximum accuracy. We focus on finding the "quiet" accumulation before the "loud" breakout. This provides earlier entry points into momentum trends while others are still waiting for confirmation.
Scaling Your Intelligence with TickerAI Full-Access
Moving from a "searching" mindset to a "reviewing" mindset is the hallmark of a professional. Individual traders often waste hours on manual data entry and screening. TickerAI Full-Access provides institutional-grade discovery that handles the heavy lifting. You spend your time making final decisions, not scrolling through endless charts. It's about scaling your intelligence through automated market scanning. Whether you choose the Pro or Full-Access tier, you're gaining a high-speed intelligence partner. Transition your workflow from manual effort to algorithmic execution and start focusing on the trades that matter.
Mastering High-Momentum Execution
The transition from manual observation to algorithmic precision is mandatory for modern traders. Success depends on a systematic framework that prioritizes institutional accumulation over retail noise. By mastering technical pillars like relative strength and volume expansion, you've learned the fundamental mechanics of how to find breakout stocks before the mass market reacts. Consistency is a choice; it's the result of a repeatable workflow that eliminates emotional bias and focuses on quantifiable data.
Stop wasting hours on manual screening and start reviewing high-conviction opportunities. Leverage institutional-grade discovery tools to gain a proactive edge in a fast-moving environment. Discover high-momentum breakouts with TickerAI Full-Access and gain access to AI-driven swing trade alerts alongside real-time market anomaly detection. Your ability to execute with clinical precision starts with the quality of your intelligence. Let the data drive your performance and take control of your trading future. The market rewards the prepared; stay disciplined and execute with confidence.
Frequently Asked Questions
What is the best indicator for finding breakout stocks?
Relative Strength (RS) is the most effective technical indicator for this strategy. It identifies assets that are outperforming the broader market or their specific sector. When you combine RS with a volume spike of at least 200% above the daily average, you isolate high-conviction moves. This technical combination is a core component of how to find breakout stocks that have the momentum to sustain a multi-day or multi-week trend.
How do I avoid false breakouts (fakeouts)?
Avoiding false breakouts requires filtering for institutional backing rather than retail hype. You should look for volume confirmation and "tightness" in the price action before the move occurs. If the breakout happens on low volume, it's likely a trap. Utilizing AI-driven anomaly detection helps identify whether "Smart Money" is actually participating in the move. This systematic approach reduces emotional entries and ensures you're participating in high-probability setups with verified accumulation.
Is volume important for a stock breakout?
Volume is the essential fuel for any sustainable price movement. A breakout without a significant volume expansion usually indicates a lack of conviction from institutional players. Professional traders look for a minimum of 2x or 3x the average daily volume to confirm that a resistance level has been structurally breached. Without this surge in liquidity, the stock is prone to "failing back" into its previous range as demand quickly evaporates.
Can AI really predict a stock breakout before it happens?
AI identifies quantifiable anomalies and accumulation patterns that precede major moves. TickerAI’s algorithms scan thousands of tickers to detect subtle institutional footprints and unusual option activity that manual charting often misses. By recognizing these data points early, the system provides a proactive edge. This allows users to position themselves in high-potential setups before the breakout becomes obvious to the general retail public, moving from reactive searching to proactive review.
What is the difference between a breakout and a gap up?
A breakout is defined by price moving through a specific technical resistance level, such as a previous high. A gap up occurs when a stock opens at a price significantly higher than its previous close, often due to overnight news or earnings. While a gap up can lead to a breakout, they aren't the same. Understanding the distinction is vital for how to find breakout stocks that offer a clean, tradable entry rather than a "chase" scenario.
How long should I hold a breakout stock?
Your holding period should be determined by your specific trading plan and the stock's technical health. Many swing traders hold as long as the stock remains above its 10-day or 20-day moving average. If the breakout leads to a powerful trend, you might hold for weeks. Conversely, if the stock closes back below the breakout point, you should exit immediately. Professional trade management relies on following the price action rather than picking arbitrary dates.
Should I buy a breakout on the first day or wait for a retest?
Buying on the first day of a high-volume breach offers the highest potential reward but carries more risk of a "fakeout." Waiting for a retest of the breakout level as new support is a more conservative approach. This secondary entry often provides a lower-risk opportunity because it confirms that the previous resistance has successfully flipped to support. Both methods are valid; your choice depends on your risk tolerance and the speed of the current market.
What time of day is best to find breakout stocks?
The first and last hours of the trading session are the most productive for finding high-momentum moves. The market open (9:30 AM to 10:30 AM EST) provides the initial volatility as overnight orders are processed. The final hour (3:00 PM to 4:00 PM EST) reveals institutional conviction as funds finalize their positions for the day. Scanning during these windows ensures you're capturing the periods of highest liquidity and most significant price discovery.


