

The era of manual chart-chasing is officially over. With FINRA margin debt hitting a record $1.502 trillion in June 2026, market velocity has outpaced the human eye. You've likely felt the sting of analysis paralysis or the frustration of entering a trade just as the momentum fades. Learning how to find swing trading opportunities in this environment requires a shift from subjective observation to clinical, algorithmic precision. Manual scanning is no longer a viable strategy. It's a bottleneck that limits your capital growth and your ability to scale.
It's time to stop reacting to the market and start anticipating it. You'll learn how to transition from tedious manual research to a systematic, AI-driven discovery process that identifies high-probability setups before they hit mainstream scanners. This guide outlines a repeatable workflow designed for earlier momentum detection and reduced research time. We'll examine how the June 2026 elimination of the pattern day trader rule changed the landscape and how you can use automated intelligence to secure a professional edge in a fast-moving environment.
Key Takeaways
- Shift from lagging technical indicators to real-time algorithmic scanning to detect institutional momentum shifts across thousands of tickers simultaneously.
- Learn how to find swing trading opportunities by prioritizing Relative Strength, focusing on assets that consistently outperform market benchmarks.
- Transition to "Smart Watchlists" that utilize thematic filtering to categorize trade ideas by sector catalysts and automated signals.
- Implement a rigorous 1% risk management rule and a rule-based execution framework to protect capital in high-velocity market environments.
- Leverage AI-driven discovery to automate the search phase, allowing you to focus your resources on high-level decision-making and execution.
The Mechanics of High-Probability Swing Trade Setups
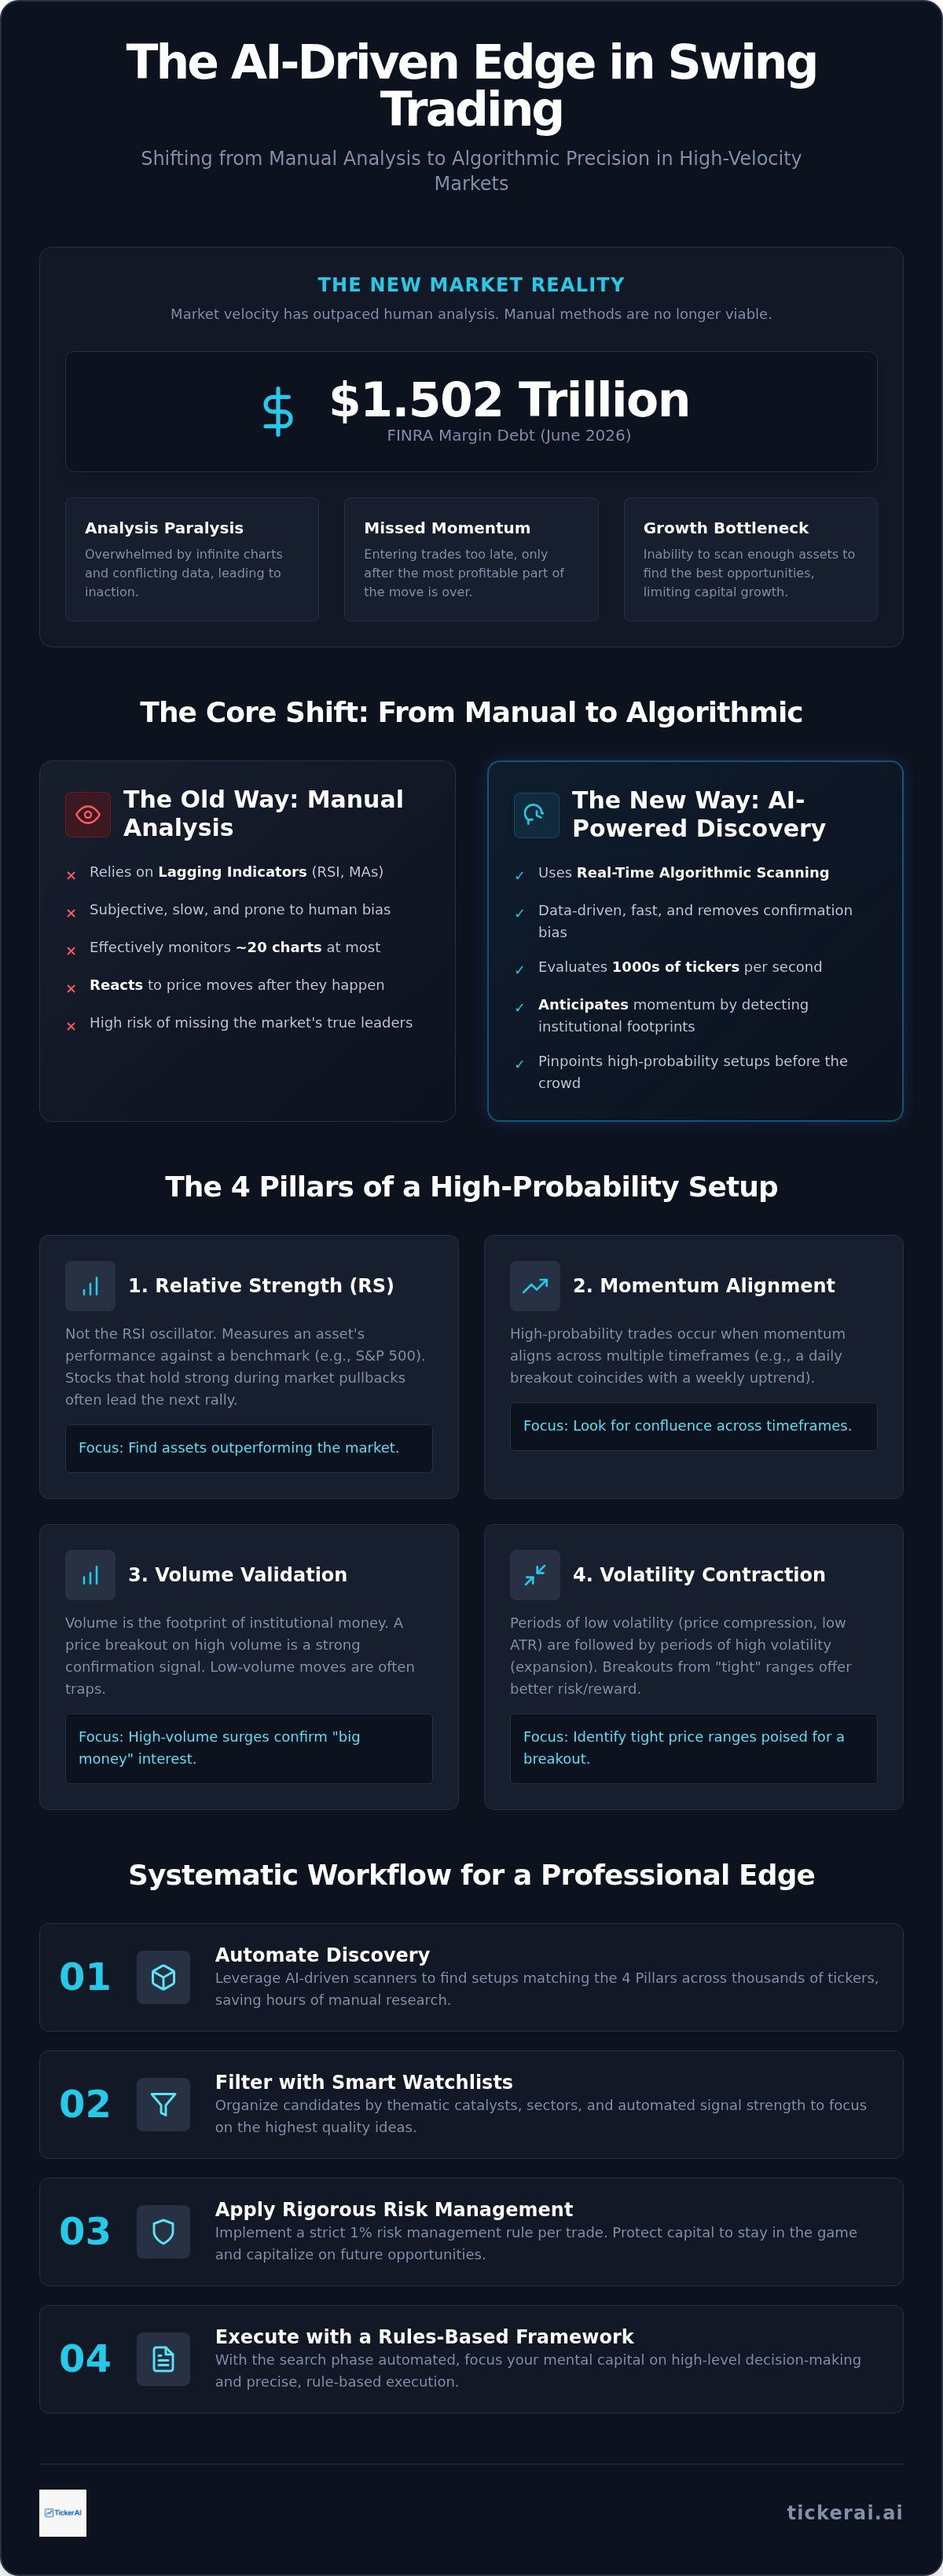
Swing trading is the strategic practice of capturing price moves over a timeframe of several days to several weeks. It occupies the space between the frantic pace of day trading and the slow burn of long-term investing. To master how to find swing trading opportunities, you must accept that high-probability setups are rarely accidental. They're the result of institutional accumulation and identifiable market cycles. Success requires a clinical focus on four pillars: relative strength, momentum alignment, volume validation, and volatility contraction.
You must first identify the current market environment. Momentum strategies thrive in trending markets, while mean reversion works best in range-bound conditions. Applying a breakout strategy to a choppy market is a recipe for consistent stop-outs. Volume serves as your primary validation tool. A price breakout occurring on low volume is often a trap designed to lure retail participants before a reversal. Institutional interest leaves a footprint. High-volume surges confirm that the "big money" is moving the needle. If the volume is absent, the opportunity is likely an illusion.
Relative Strength and Market Correlation
Relative strength (RS) is the most reliable lead indicator for professionals. This is not the RSI oscillator; it's a measure of an asset's performance relative to a benchmark like the S&P 500. When the broad market pulls back, stocks that trade sideways or show resilience become your primary targets. These assets are being supported by "strong hands" despite market-wide selling pressure. Once the benchmark stabilizes, these resilient stocks are usually the first to reach new highs. Using the S&P 500 as a baseline allows you to filter out laggards and concentrate capital on the market's true leaders. Strength persists; weakness lingers.
Volatility and Range Analysis
Volatility is cyclical. Periods of low volatility, or compression, inevitably lead to periods of high volatility, or expansion. High-probability setups often emerge from "tight" price ranges where the Average True Range (ATR) has decreased significantly. This contraction signals a balance between buyers and sellers that is nearing a breaking point. Analyzing these cycles is fundamental to how to find swing trading opportunities that offer an asymmetric risk-to-reward ratio. By measuring ATR, you can set realistic profit targets based on the stock's actual movement capacity. Distinguishing between healthy consolidation and a trend reversal is critical. Healthy consolidation occurs on declining volume. A trend reversal, however, often starts with a high-volume "exhaustion" candle that violates established support levels.
Technical Indicators vs. Algorithmic Scanning: Modern Discovery
Traditional technical analysis is failing the modern trader. In a market where high-frequency algorithms dominate price action, relying on 1970s-era oscillators like RSI or standard Moving Averages is a strategic liability. These lagging indicators calculate historical data; they confirm a move only after the most profitable entry window has closed. Professionals now use sophisticated data-driven methods to identify swing trading candidates, shifting from manual observation to real-time screening. Understanding how to find swing trading opportunities in 2026 requires moving beyond what happened yesterday to what is being positioned right now.
The core problem is scale. A human trader can monitor perhaps twenty charts effectively. An algorithmic scanner evaluates thousands of tickers every second. With the elimination of the pattern day trader rule in June 2026, the influx of retail market noise has reached unprecedented levels. This makes automated filtering essential. The shift toward data-driven discovery is the only way to master how to find swing trading opportunities consistently. The goal is no longer to manually read a chart. It is to detect the mathematical anomalies that precede institutional momentum.
Automating Technical Analysis
Manual trendline drawing is subjective and prone to confirmation bias. By utilizing automated technical analysis automation, traders can scale their intelligence across multiple timeframes simultaneously. This process identifies confluence. When a daily breakout aligns with a weekly momentum surge and a four-hour volume spike, the probability of trade success increases. AI filters out the noise of false breakouts by analyzing order flow and liquidity depth. This protects your capital from the traps that often catch retail participants who rely on basic, static indicators.
Detecting Institutional Footprints
Institutional "Smart Money" does not enter positions in a single block. They utilize dark pools and fragmented orders to hide their accumulation phases. Modern discovery tools track these footprints by monitoring unusual volume signatures and block trade activity that remains invisible to standard retail platforms. Anomaly detection serves as a high-precision tool for spotting hidden market movements before they manifest in standard price charts. By the time a stock goes viral on social media, the institutional move is often near completion. To stay ahead, you need a proactive scout. Using real-time AI discovery tools allows you to enter trades alongside the institutions rather than providing them with exit liquidity.
Constructing a Systematic Watchlist and Filtering Market Noise
Static watchlists are a legacy approach that no longer serves the professional trader. These lists represent a snapshot in time; they often become "stale" within hours of creation. In the current high-velocity environment, a static list is a liability. It forces you to look backward at what was strong, rather than what is becoming strong. A "Smart Watchlist" functions as a dynamic, logic-driven engine. It populates and depopulates based on live market mechanics, relative strength, and volume surges. Mastering how to find swing trading opportunities in 2026 requires building a system that filters out the noise before it reaches your desktop. You need a proactive scout that prioritizes assets showing immediate momentum. This keeps your focus on the most active segments of the market, ensuring you don't waste capital on stocks that are currently dormant.
Thematic Opportunity Discovery
Capital is never static. It rotates between sectors based on macroeconomic catalysts and institutional appetite. By finding thematic investment opportunities with AI, you can streamline the discovery process. Instead of scanning random tickers, you group assets by their primary drivers. For example, grouping high-growth AI stocks with their energy infrastructure counterparts provides a clearer picture of market flow. Sector rotation analysis is critical for timing. Entering a strong stock in a weak sector often leads to sideways price action. You want the wind at your back. Identifying these themes early allows you to position yourself ahead of the retail crowd. Whether it's a breakthrough in Biotech or a policy shift in Green Energy, thematic grouping provides the necessary context for price action.
Filtering for Action-Oriented Signals
The greatest challenge for modern traders isn't a lack of information; it's a surplus. Analysis paralysis occurs when you try to process too many conflicting indicators or news stories. You must establish a "gatekeeper" protocol. This involves setting strict, non-negotiable criteria for what constitutes a high-potential setup. If a ticker doesn't meet your specific volatility and volume requirements, it doesn't belong on your screen. The psychology of success is the ability to ignore 99% of market data. You are looking for the narrow 1% where technical alignment meets institutional momentum. AI tools now quantify sentiment and predict price action with high accuracy, but your role is the final execution. Real-time alerts maintain your proactive stance. They ensure you only engage when the market presents a specific, high-probability window. This disciplined focus is the only way to master how to find swing trading opportunities without succumbing to the exhaustion of manual research.
Validating Opportunities: Risk Management and Rule-Based Execution
Discovery is a vanity metric without execution. Your systematic process for how to find swing trading opportunities must feed directly into a rigid risk framework. Most traders fail because they confuse a good setup with a good trade. A trade is only as good as its management. To protect your capital, adhere to the 1% Rule: never risk more than 1% of your total account equity on a single position. This isn't about position size; it's about the dollar value between your entry and your stop-loss. If your account is $50,000, your maximum loss per trade is $500. This calculation dictates your share count, not your "gut feeling."
Consistency requires a lack of bias. By using AI to remove emotion from trading, you replace fear and greed with clinical logic. Algorithmic signals provide objective entry and exit points that don't fluctuate based on market headlines or social media hype. You aren't guessing where the price might go; you're executing a plan based on where the data says the probability lies. This systematic discipline is what separates professional swing traders from retail hobbyists. Access pre-validated swing trade setups to automate your risk assessment and focus on high-probability execution.
Developing a Repeatable Entry Protocol
A high-probability entry requires a three-step validation process. First, identify the primary signal through algorithmic scanning. Second, confirm the move with institutional volume signatures. Third, check the broad market health to ensure you aren't trading against the primary trend. This confluence of data points is your final filter. Use limit orders to control your entry price. Market orders in swing trading lead to unnecessary slippage, especially in volatile 2026 conditions. When multiple signals align in one direction, the probability of a sustained move increases. Don't chase. If the price misses your limit, let the trade go. There is always another setup.
Dynamic Risk Management
Generic, fixed-percentage stop-losses are a strategic error. They don't account for the unique volatility of each asset. Instead, adjust your stop-losses based on the Average True Range (ATR). A high-beta tech stock requires a wider stop than a stable utility stock to avoid being shaken out by normal price noise. Trailing stops are essential for locking in profits as the trade moves in your favor. This allows you to capture the bulk of a swing move while giving the asset enough room to breathe through minor pullbacks. Maintaining a minimum 2:1 reward-to-risk ratio is the non-negotiable requirement for long-term swing trading success. If the chart doesn't offer this mathematical advantage, the trade doesn't exist.
Scaling Your Discovery Process with TickerAI
Manual research is the ultimate bottleneck for the modern swing trader. While understanding the mechanics of relative strength and volume is essential, doing the work by hand limits your output. You're restricted by the number of charts you can physically view. TickerAI shifts the paradigm by automating the search phase, allowing you to focus exclusively on the decision phase. This is how to find swing trading opportunities at scale. By deploying an AI-driven scout, you move from a reactive state of "chasing moves" to a proactive state of "executing setups." The technology doesn't replace your judgment; it amplifies it by delivering high-probability candidates that meet your specific criteria in real time.
There is a fundamental difference between following blind alerts and understanding how to interpret AI stock signals. Professional traders use algorithmic discovery as a filter, not a substitute for strategy. TickerAI provides the signal, but your execution framework provides the profit. Integrating these alerts into your workflow ensures that you are only looking at assets with confirmed institutional footprints. This clinical approach eliminates the emotional fatigue of scanning thousands of dead-end tickers and keeps your capital deployed where it has the highest mathematical advantage.
The TickerAI Edge: Speed and Precision
Market velocity in 2026 demands immediate awareness. TickerAI provides real-time scanning across US and global markets, detecting momentum breakouts the moment they occur. This isn't just raw data; it's filtered intelligence. Every alert has passed through rigorous AI parameters designed to identify the "compression before the expansion" mentioned in previous sections. Your smart watchlists evolve dynamically. As market conditions shift, the AI reprioritizes your list, ensuring you're always focused on the most resilient sectors. This speed is your primary edge over retail participants who are still waiting for lagging indicators to cross.
Choosing Your Research Tier
Efficiency requires the right tool for your specific frequency. TickerAI offers two primary paths for scaling your intelligence. The Pro subscription is engineered for the active swing trader, providing real-time market alerts and smart watchlists that focus on short-to-medium term momentum. For those who want a comprehensive view, the Full-Access subscription adds long-term investment ideas to the mix. The value lies in the transition from raw data to actionable ideas. You no longer need to spend hours wondering how to find swing trading opportunities in a chaotic market. The system does the work, and you make the call. Start discovering high-potential swing trades with TickerAI and reclaim your time for high-level decision-making.
Command the 2026 Market with Systematic Discovery
The transition from manual chart scanning to algorithmic discovery isn't just a convenience; it's a requirement for survival in a high-velocity environment. You now have the framework to identify relative strength, validate momentum with volume, and manage risk using ATR-based protocols. By moving away from lagging oscillators and adopting a data-driven approach, you eliminate the emotional bias that often leads to late entries and premature exits. Success in this landscape belongs to those who prioritize logic over intuition.
Mastering how to find swing trading opportunities is about narrowing your focus to the narrow percentage of assets showing genuine institutional footprints. You don't need more data; you need better filters. TickerAI provides the professional-grade smart watchlists and real-time actionable alerts necessary to maintain this edge. Deploy our AI-driven discovery engine to automate your research and focus your intelligence on high-level execution. The tools are ready. It's time to trade with clinical precision.
Unlock AI-Powered Swing Trade Setups with TickerAI
Frequently Asked Questions
What is the best timeframe for finding swing trading opportunities?
The daily chart is the primary timeframe for how to find swing trading opportunities that capture significant multi-day trends. Professionals use the weekly chart to establish the dominant trend and the 4-hour chart to refine entry points. This hierarchical approach ensures you're trading in alignment with institutional momentum rather than fighting against it. Multi-timeframe alignment is the foundation of high-probability discovery.
Can AI really predict swing trade breakouts before they happen?
AI doesn't predict the future; it calculates the mathematical probability of a breakout based on historical patterns and real-time data anomalies. It identifies the specific conditions, such as volatility contraction and institutional accumulation, that typically precede a major move. This allows you to position yourself before the retail volume surge. It's about detecting the setup phase before the expansion phase begins.
How many stocks should be on a swing trading watchlist?
A professional swing trading watchlist should focus on 10 to 20 high-conviction tickers. Maintaining a bloated list leads to analysis paralysis and missed entries. A "Smart Watchlist" should be dynamic, automatically removing laggards and adding assets that show a surge in relative strength. Quality discovery requires a tight focus on the market's most resilient and active participants.
Is swing trading better than day trading for beginners?
Swing trading is generally superior for beginners because it reduces the psychological pressure of real-time decision-making. The elimination of the pattern day trader rule on June 4, 2026, removed the $25,000 minimum balance requirement, making it easier for smaller accounts to participate. Swing trading allows you to capture larger price moves with less time spent staring at a screen during market hours.
What are the most reliable indicators for swing trading in 2026?
Relative Strength (RS) compared to a benchmark like the S&P 500 remains the most reliable lead indicator. Volume confirmation is equally critical; a breakout without institutional volume is often a trap. Professionals also utilize the Average True Range (ATR) to set objective, volatility-based stop-losses. Avoid lagging oscillators like RSI, which often stay "overbought" during the most profitable parts of a trend.
How much capital do I need to start swing trading with AI alerts?
You can start with as little as $1,000 to $2,000, provided you maintain strict risk management. The SEC fee rate for registration decreased to $138.10 per million on October 1, 2025, which slightly lowers the cost of high-volume trading. AI alerts maximize capital efficiency by identifying setups with high asymmetric reward-to-risk ratios, allowing you to grow a smaller account through systematic execution.
How do I filter out 'noise' when looking for swing trades?
Filter out noise by using algorithmic scanners that prioritize institutional order flow over social media sentiment. Noise is characterized by low-volume price spikes and erratic intraday movements. To understand how to find swing trading opportunities that are genuine, look for price consolidation on declining volume followed by a high-volume breakout. If the volume footprint is missing, the move is likely noise.
What is the difference between a swing trade and a long-term investment?
The primary difference is the time horizon and the objective. Swing trades aim to capture price "swings" over several days to weeks based on technical setups and momentum. Long-term investments focus on fundamental growth over years. While an investor might ignore a 10% pullback, a swing trader uses that volatility to exit or enter a position based on predefined technical rules.


