

A tech stock that passes every filter is still a research lead, not a buy signal. That distinction matters when you’re learning how to screen for tech stocks. The sector spans fast-growing software firms, semiconductor makers, and companies building the physical infrastructure behind AI. A long list of tickers and metrics can quickly obscure the signals worth investigating.
You need more than a growth filter. Combining business fundamentals with market behavior and risk can help narrow the field, but each metric reveals only part of the picture. A screen may surface an overvalued company, miss an emerging business, or favor a pattern that doesn’t fit your investment goals.
This guide shows you how to build a repeatable, sector-aware screen for 2026, interpret common filters, and turn results into a focused research queue. You’ll work through company quality, valuation, price trends, and risk, then see how watchlists and alerts can help you monitor candidates. AI-powered discovery can surface stocks for investor-led research, but the final judgment remains yours: a shortlist is a starting point, not a recommendation.
Key Takeaways
- Separate software, semiconductor, and hardware companies before comparing metrics; the same threshold can mean different things for different business models.
- Learn how to screen for tech stocks by grouping filters around fundamentals, growth, valuation, liquidity, and market behavior.
- Check metric definitions, reporting periods, and data sources so inconsistent inputs don’t shape your screen.
- Set a clear purpose, such as long-term research or swing-trade discovery, then use a repeatable workflow to review and monitor candidates.
- Use AI-powered discovery, smart watchlists, and real-time alerts to track candidates while keeping your own research central to decisions.
Why screening technology stocks needs more than a ticker list
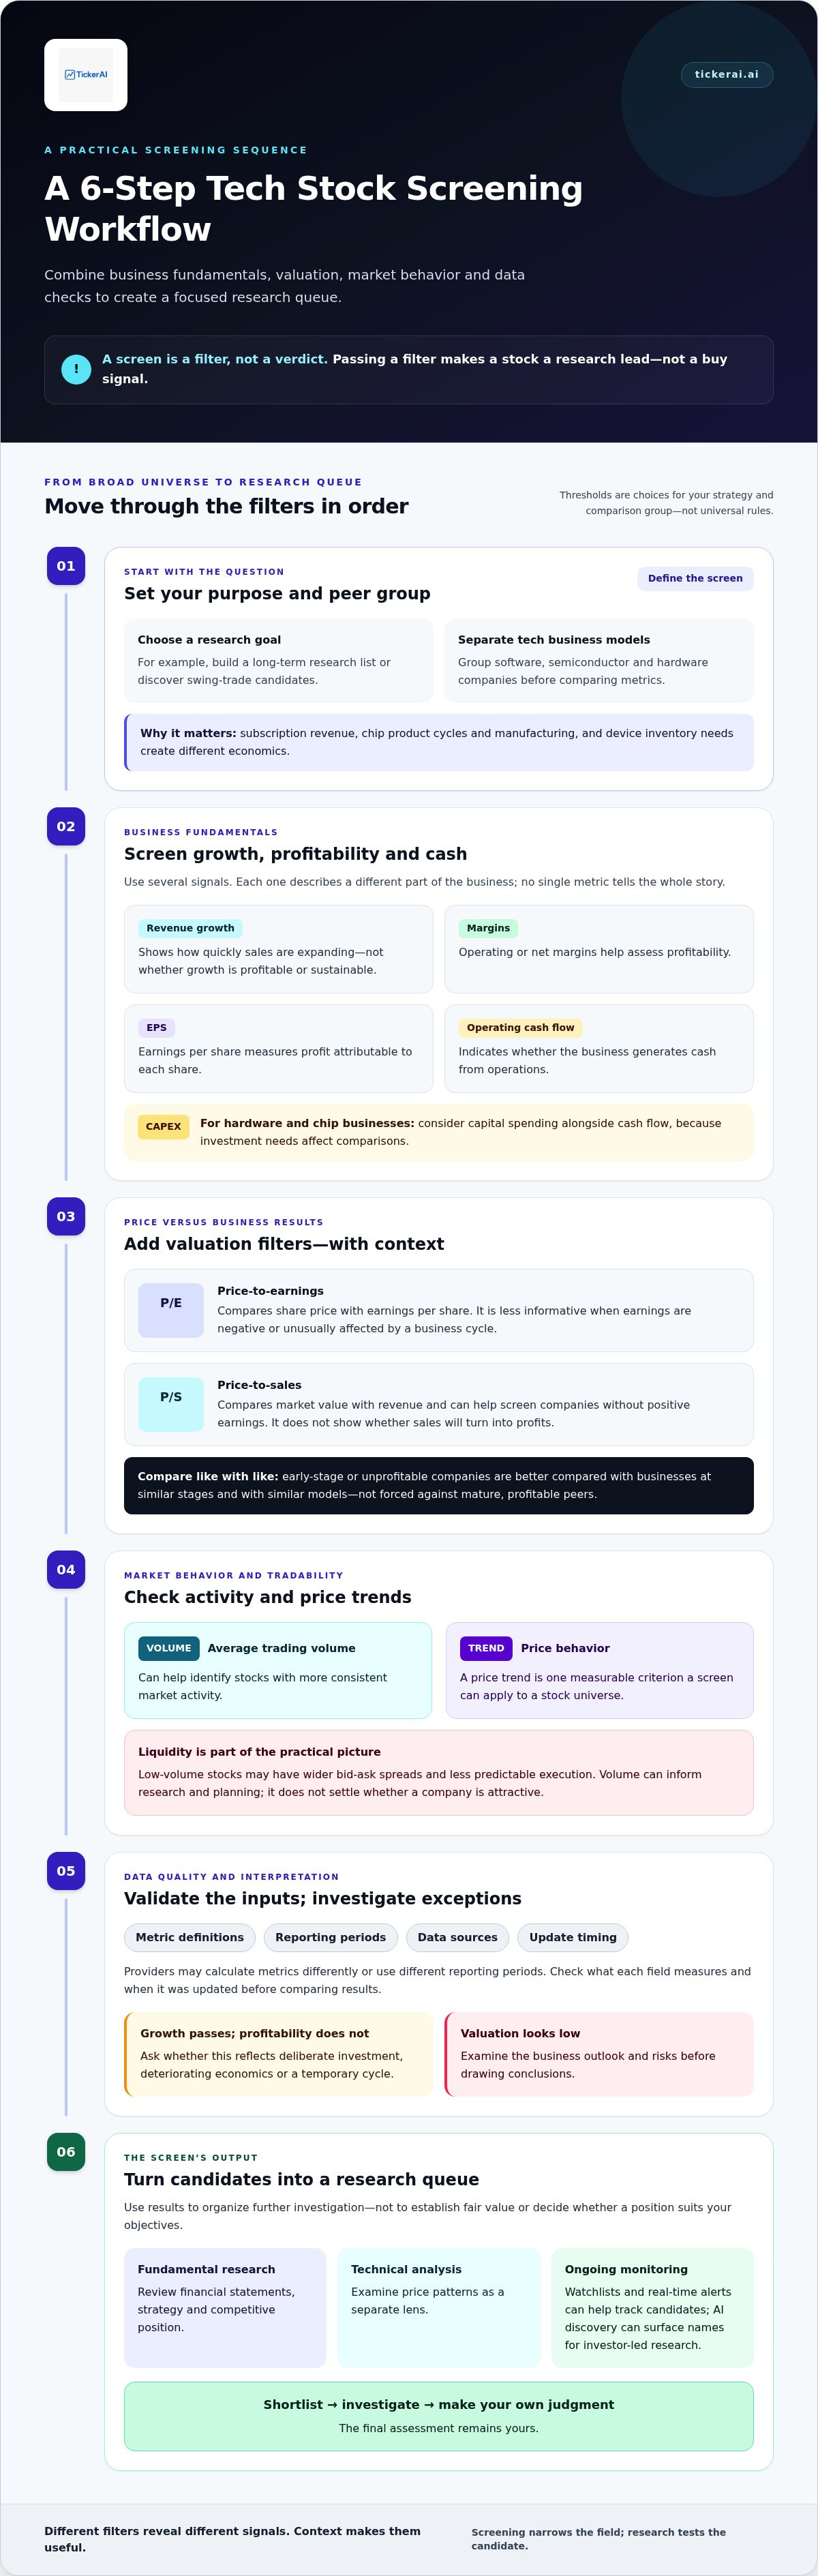
A stock screen is a filter, not a verdict. It applies selected criteria to a broad universe of stocks and returns candidates for further research. Put simply: screening narrows the field; company research tests whether a candidate merits your attention.
That distinction matters in technology. The sector includes subscription software businesses, semiconductor designers and manufacturers, and device makers. Their revenue drivers, costs, and investment needs differ. A software company may earn recurring subscription revenue, while a chipmaker can depend on product cycles and manufacturing capacity. A device business may face inventory costs and frequent product launches.
What does a technology-stock screen actually do?
To understand how to screen for tech stocks, start with the mechanics: select measurable criteria, such as revenue growth, operating margin, valuation, trading volume, or price trend, and apply them to a chosen stock universe. The output depends on your criteria and on the quality, timing, and definitions of the underlying data.
A screen isn’t fundamental analysis, which examines a company’s financial statements, strategy, and competitive position. It isn’t technical analysis, which examines price patterns, or trade execution. A screen can organize candidates for those next steps, but it can’t establish fair value or determine whether a position suits your objectives.
Why one set of filters can mislead across tech
Identical thresholds can produce misleading comparisons. A young software firm reinvesting heavily in growth may have low or negative profits, while a mature software business may be judged more on margins and cash generation. Chipmakers can face substantial research and manufacturing costs, with demand shifting through industry product cycles. Device companies also need to manage production, inventory, and launch timing.
Growth, profitability, and valuation metrics need context. Rapid sales growth may signal expansion, but it doesn’t show whether that growth is profitable or sustainable. A high price-to-earnings ratio may reflect strong expectations, but it doesn’t show whether those expectations are realistic. Compare companies with similar business models and stages before treating a metric as a ranking.
Technology changes quickly. New products can alter customer demand, while competitors can pressure prices or make existing offerings less attractive. Market expectations may move faster than reported financial results, so a screen based on the latest available figures can miss a recent shift. Data providers may also use different reporting periods or metric calculations. Before comparing results, check what each field measures and when it was updated.
Use filters to expose patterns, then investigate exceptions. If a company passes a growth threshold but falls short on profitability, ask whether that reflects deliberate investment, deteriorating economics, or a temporary cycle. If a valuation looks low, examine the business outlook and risks before drawing conclusions. A disciplined screen makes the research queue more manageable, but each company still needs to be assessed in the context of its business model.
Which filters help screen technology stocks?
Build a screen around the question you want it to answer. For a quality-focused research list, start with business fundamentals and growth. For a valuation review, add price-based ratios. Liquidity and market-behavior filters can help assess how actively a stock trades and how its price has performed. No single filter set fits every tech company or research goal.
Combining complementary filters narrows the field more effectively because each one tests a different part of the investment case. Treat thresholds as choices suited to your strategy and comparison group, not as universal rules. A strict margin requirement, for example, could exclude a growing company investing heavily in product development, while a growth-only screen could overlook weak cash generation.
Fundamental and valuation filters for tech companies
Use fundamentals to examine distinct signals, not to create a single score. Revenue growth shows how quickly sales are expanding, but not whether the company is profitable. Operating or net margins help assess profitability. Earnings per share (EPS) measures profit attributable to each share, while operating cash flow indicates whether the business is generating cash from operations. For hardware and chip businesses, consider capital spending alongside cash flow because investment needs affect comparisons.
Valuation ratios provide another lens. The price-to-earnings (P/E) ratio compares a share price with earnings per share; it’s less informative when earnings are negative or unusually affected by a business cycle. Price-to-sales (P/S) compares market value with revenue, so it can help screen companies without positive earnings. However, it doesn’t show whether sales will translate into profits. For early-stage or unprofitable firms, compare businesses with similar models and development stages rather than forcing a comparison with mature, profitable peers.
Market activity and tradability filters
Average trading volume can help identify stocks with more consistent market activity. Liquidity matters because it affects how readily shares can generally be bought or sold. Low-volume stocks may have wider bid-ask spreads and less predictable execution. Use volume as a practical research and planning filter, not as proof of business quality.
Relative strength compares a stock’s performance with a benchmark or peer group over a selected period. It can flag stronger or weaker recent price behavior, but it doesn’t explain the cause or show that a company’s fundamentals are sound. Keep chart-based signals separate from judgments about the underlying business.
Before relying on results, check each metric’s definition, reporting period, and data source. One screener may use trailing financial data, while another displays a different period or calculation. Confirm whether growth is year-over-year or based on another interval, and whether a valuation ratio uses trailing or forward earnings. These choices can change which companies pass your filters.
As you apply how to screen for tech stocks principles, record each screen’s purpose and settings so you can interpret results consistently. For ongoing candidate discovery, AI-powered stock opportunity discovery can complement your own filters, while smart watchlists and real-time alerts help you monitor candidates for further investor-led research.
How to judge a tech-stock screen without mistaking it for a buy signal
A company can pass every filter and still be overvalued, financially exposed, or poorly matched to your goals. A screen identifies stocks that meet selected conditions. It doesn’t establish fair value or predict future returns. Treat each result as a prompt for investigation, not a decision.
Use this check to turn screen signals into research questions:
| Filter signal | What it may suggest | What it cannot prove |
|---|---|---|
| Fast revenue growth | Sales have expanded over the selected period. | That growth will continue or generate profits. |
| Low P/E or price-to-sales ratio | The stock’s price is low relative to a selected earnings or sales measure. | The shares are undervalued or comparable to peers. |
| Strong relative strength | The stock has outperformed a benchmark over the measured period. | Momentum will persist or the company is fundamentally strong. |
| High trading volume | The shares have seen substantial market activity. | The business is high quality or free of investment risk. |
What a filter can reveal, and what it cannot
A growth filter captures reported results for a defined period. It won’t show whether growth came from a lasting demand shift, a temporary product cycle, or a one-off contract. Read company filings and current disclosures to understand the drivers, and check whether reporting periods are comparable across candidates.
Valuation ratios also need context. A low multiple could reflect weak prospects, unusual earnings, or a business model unlike those of its peers. A high multiple may reflect strong expectations, but it doesn’t confirm those expectations are achievable. Past price strength is a historical signal, not a promise of continued momentum.
Check risk before promoting a candidate
Before advancing a stock to deeper research, review liquidity and volatility. A thinly traded stock can be harder to transact in, while sharp price swings can increase uncertainty. Consider concentration too: a company may depend heavily on one product, a small customer group, or a single market theme. If that driver weakens, the impact could be outsized.
Separate three layers of risk. Company-specific risk includes execution problems, customer dependence, and product competition. Sector exposure can arise when several candidates rely on similar technologies or demand drivers. Broader market conditions, including interest-rate changes or shifts in investor risk appetite, can affect technology valuations across multiple business models. A screen that appears diversified may still cluster around one shared risk.
False positives can also result from stale financial data, one-off results, or unsuitable peer comparisons. Verify the latest available filings, inspect unusual changes, and compare each company with businesses at similar stages and with similar economics. This validation step is essential to how to screen for tech stocks responsibly: filters organize the research queue, while company-level analysis helps explain what the signals mean.
How to build a repeatable technology-stock screening workflow
A repeatable process makes each screen easier to interpret and compare over time. Start with a defined objective, record your settings, and review candidates before adding them to a research queue. The goal is consistency, not a longer list of filters.
Set the universe and choose filters with a purpose
Before applying criteria, decide what you’re looking for. Long-term research may focus on business fundamentals and financial resilience; swing-trade discovery may put more weight on liquidity and recent market behavior. These are different research objectives, so don’t use one screen as a substitute for the other.
Then define the stock universe. Specify which technology segments you want to examine, such as software, semiconductors, or hardware. Set any market-capitalization or liquidity boundaries to fit your intended scope. Choose a small group of complementary filters tied directly to your objective. Adding criteria simply to shorten the results list can exclude relevant companies without improving the screen.
Validate, document, and revisit the shortlist
Use this sequence to turn screen results into a structured research queue:
- Save the screen logic. Record the universe, filters, thresholds, data definitions, and source. Note the date you ran the screen so you can distinguish new results from changes in the data.
- Review each candidate. Compare the company with peers that have similar business models and stages. Check current company information and filings, and investigate any metric that looks unusual or conflicts with your research objective.
- Log the rationale. For each name, note which criteria it met, why it merits follow-up, and what remains uncertain. Flag assumptions, such as whether sales growth is durable or customer demand is concentrated.
- Set a review date. Revisit the shortlist on a schedule that fits your purpose, or when relevant company information changes. Re-run the same screen before changing its settings, so you can tell whether a different result came from new data or revised criteria.
This documentation makes the process auditable and helps prevent hindsight from quietly changing the reason a stock entered your list. For broader context on building a rules-based process, explore quantitative investing principles. A related guide to automated stock market analysis can also help frame where automation fits into a repeatable workflow.
To make how to screen for tech stocks a consistent research habit, use the same documented process to generate and review candidates, then adapt it only when your objective or assumptions change. AI-powered stock discovery, smart watchlists, and real-time alerts can support ongoing monitoring of a focused shortlist. Learn about AI-powered stock discovery as a complement to your independent research.
Use AI stock discovery to monitor screened technology candidates
A stock screen captures companies that meet criteria you choose. Automated discovery can add another input by surfacing potential opportunities for review, while your own process determines which candidates deserve further research. The two approaches have different roles: screening applies your defined filters, while AI-powered discovery can broaden or refresh the set of names you monitor.
Turn a shortlist into a monitored research queue
Once you’ve reviewed a screen’s results, place the candidates you want to follow on a watchlist. Keep notes on why each stock made the list and what would prompt another review. This separates companies you’re monitoring from names that merely passed a filter, helping keep your research focused as new information arrives.
Smart watchlists and real-time alerts can help track candidates and flag market activity for your attention. Treat an alert as a prompt to investigate, not an instruction to trade. For example, a stock’s price move may warrant checking relevant company news, filings, or market context before updating your view. Learn how to assess these prompts with this guide to interpreting AI stock signals.
TickerAI combines AI-powered stock opportunity discovery with smart watchlists and real-time alerts. Used alongside a user-defined screen, these tools can help keep a focused research queue visible without replacing your criteria or company-level review. See TickerAI’s AI-powered stock discovery as another way to surface candidates for independent research.
Keep discovery separate from investment decisions
Neither a stock screen nor an AI-generated opportunity establishes fair value, predicts returns, or accounts for your individual circumstances. Curated ideas can support research, but they don’t replace personal judgment or constitute financial advice. Before making a decision, apply your own process: review current company information, examine the risks, and test whether the original reasons for following the stock still hold.
That distinction is central to how to screen for tech stocks responsibly. Discovery helps organize attention; it doesn’t make the decision for you. Keep a record of the screen’s criteria, the date you ran it, and the questions each candidate raises. Revisit that record as the company or market changes, rather than relying on an old result as if it were current.
Start with a defined screen, document the criteria, then monitor selected candidates and investigate meaningful changes before drawing conclusions. That simple loop turns a one-time filter into a repeatable research practice, with automation supporting your process instead of directing it.
Make your next screen the start of a stronger research habit
Choose one technology segment and define what you want your screen to uncover. Save the criteria, review the results, and note what you learn. Over time, that record can help you refine how to screen for tech stocks without confusing a changing set of candidates with a changing investment thesis.
When you’re ready to keep candidate discovery moving, TickerAI brings together AI-powered stock opportunity discovery, smart watchlists, and real-time alerts. Curated swing trade setups and long-term investment ideas can also provide additional candidates to examine. Use these inputs to support your own research, not to replace it.
To support your next research cycle, explore TickerAI’s AI-powered stock discovery. Start with a defined screen, stay curious, and let your own analysis guide the next step.
Frequently Asked Questions
What is the best way to screen for technology stocks?
Start with a defined research goal and compare companies with similar business models. For example, if you’re studying cloud software, focus the universe on that segment before applying growth, profitability, or valuation criteria. Note why each filter matters. This makes it easier to spot when a result reflects your intended thesis rather than an accidental match caused by broad or mismatched criteria.
Which financial ratios are most useful for screening tech stocks?
No single ratio works for every technology company. P/E can help compare profitable firms with similar business models, while price-to-sales can be useful when earnings are negative or limited. Operating margin and cash flow add context about profitability and cash generation. For example, compare a chipmaker with businesses facing similar investment cycles, rather than relying on a ratio benchmarked against subscription software companies.
Can a stock screener identify undervalued technology stocks?
A screener can flag stocks that look inexpensive against a selected measure, but it can’t confirm that they’re undervalued. A low P/E might reflect temporary earnings strength or expectations of weaker future performance. After a screen surfaces a candidate, examine the company’s recent filings, debt, cash generation, and outlook. Then compare its valuation with relevant peers and consider whether the market may be pricing in risks the filter doesn’t capture.
How do I screen technology stocks for growth?
To screen for growth, start with revenue growth over a consistent period, then check whether earnings or margins are moving in the same direction. Reviewing more than one reporting period can help distinguish an ongoing trend from a short-lived jump. For a technology company investing heavily in research and development, consider that spending alongside growth metrics. The phrase how to screen for tech stocks should lead to a process that tests growth quality, not just sales acceleration.
Is technical analysis enough to screen technology stocks?
No. Technical analysis can help you examine price trends, trading volume, and relative performance, but those signals don’t explain a company’s financial position or competitive strength. A stock may show positive momentum while facing weaker demand or rising costs. Use chart-based criteria to assess market behavior, then review business fundamentals separately. Keeping these lenses distinct helps prevent a recent price move from standing in for company research.
How often should I update a technology-stock watchlist?
Set a review rhythm that matches your purpose, then make additional updates when relevant company information changes. A long-term research list might be reviewed around earnings releases, while a list used to monitor shorter-term market activity may need more frequent attention. Avoid changing criteria just because a stock’s price moved. Record what triggered each review, and remove or reclassify candidates when the original research reason no longer applies.
Can AI screen technology stocks and send alerts?
AI-powered discovery can help surface stock opportunities, and TickerAI offers smart watchlists and real-time alerts. Use an alert as a cue to review the stock’s activity and relevant company information, not as an automatic instruction or a prediction of returns. TickerAI also provides curated swing trade setups and long-term investment ideas for further research. Apply your own analysis before making investment decisions.


