

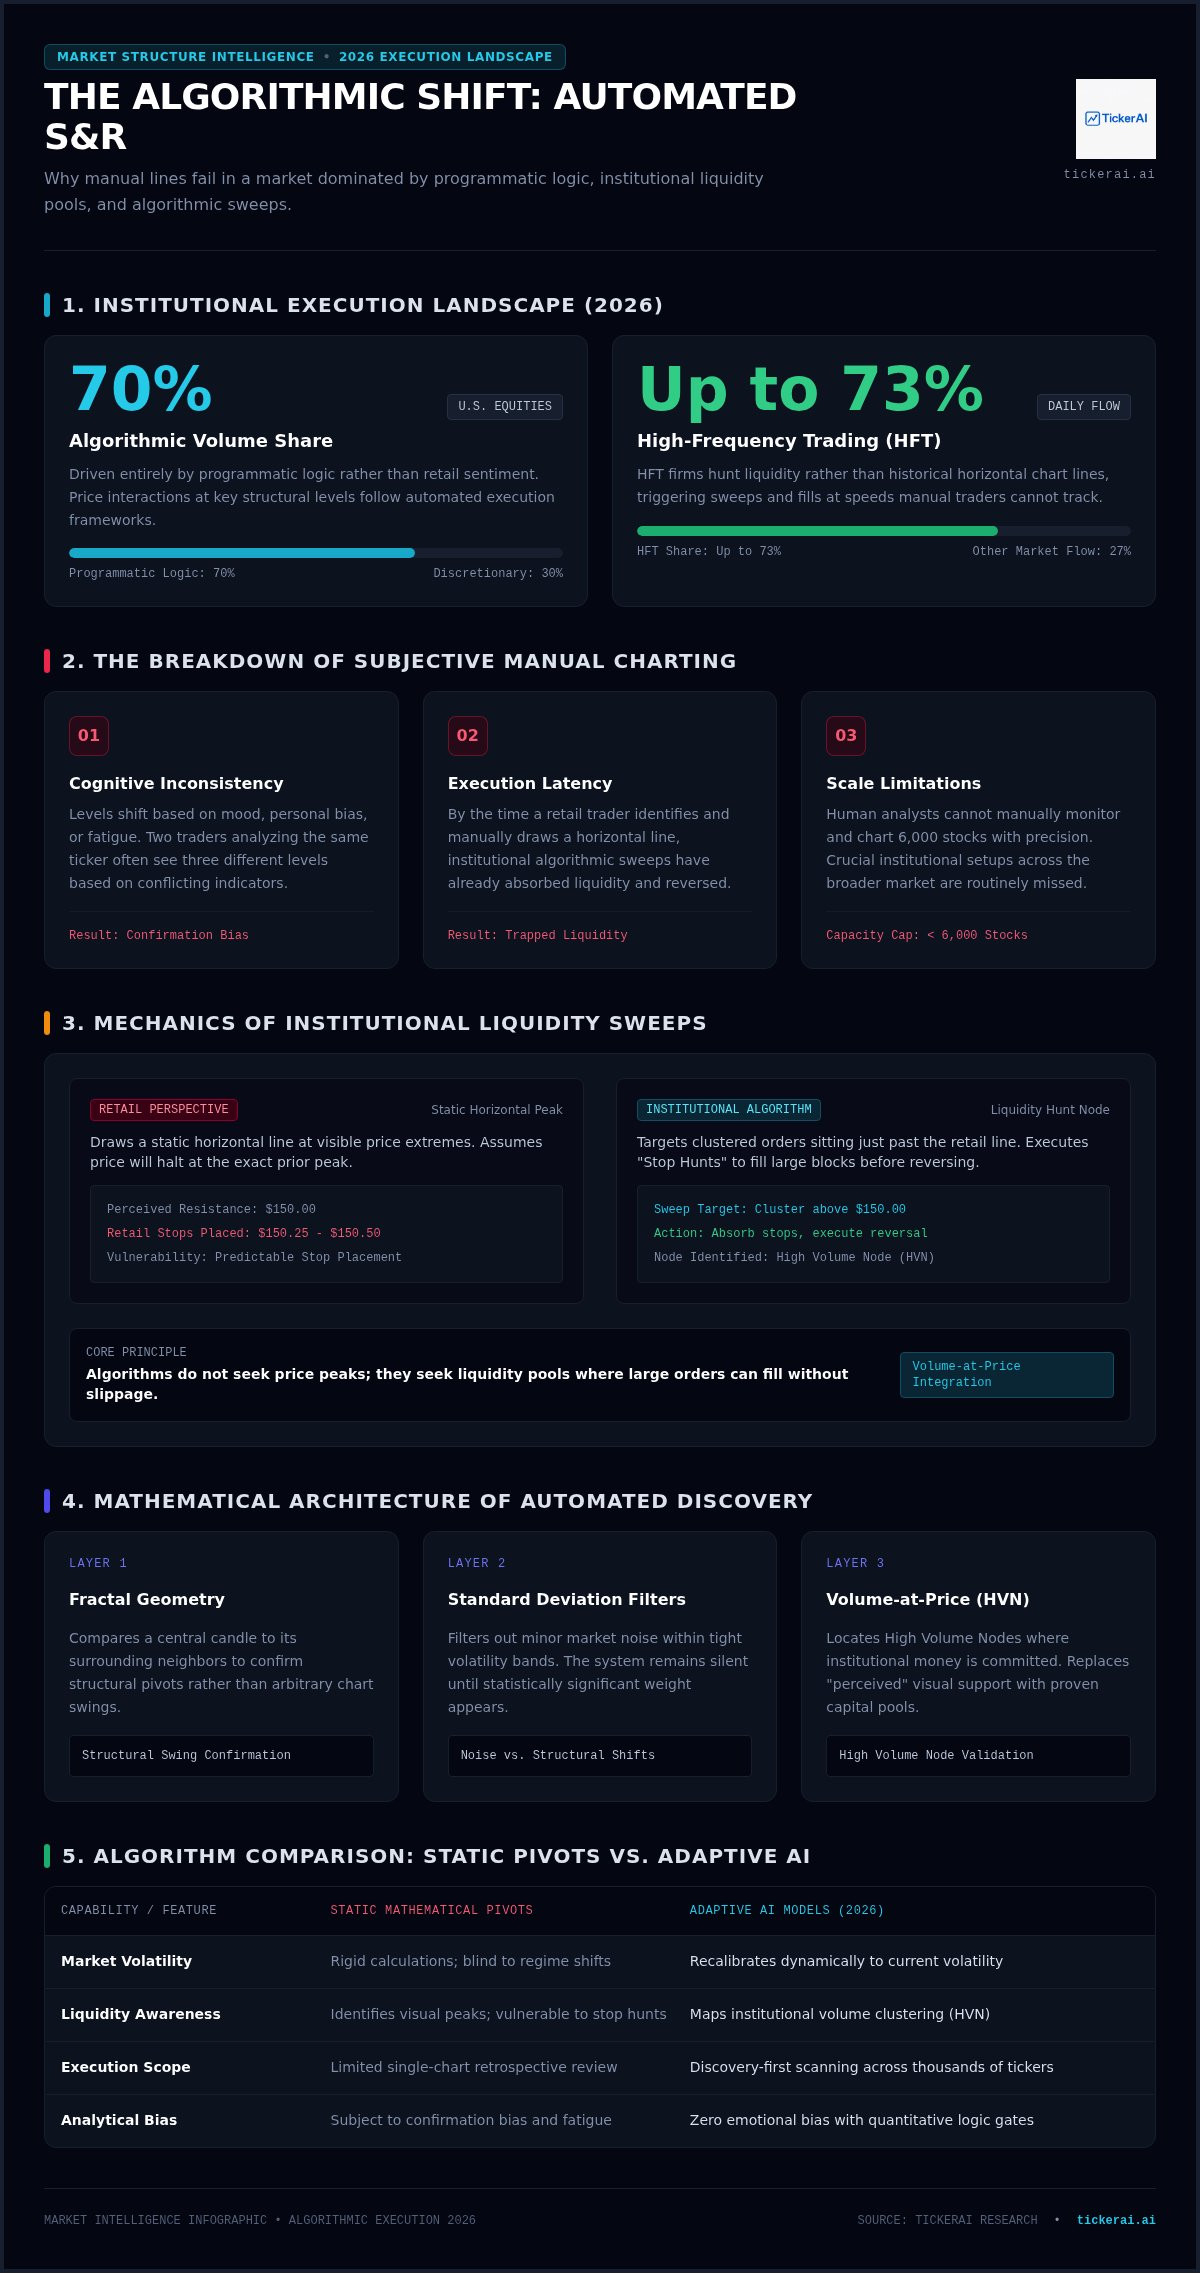
Algorithmic systems execute approximately 70% of all U.S. equity trading volume in 2026. Most price interactions at key levels are driven by programmatic logic rather than retail sentiment. If you're still manually drawing lines, you're fighting a losing battle against machines that have already mapped the liquidity. Utilizing a professional automated support and resistance level finder is no longer a luxury. It's a requirement for clinical execution. Data dictates the move; tools provide the clarity.
You're likely tired of the subjectivity in your technical analysis. One day a level holds; the next it's an algorithmic sweep. Information overload from conflicting indicators makes rapid decision-making impossible. Consistency is the only way to scale. This guide promises to move you from manual guesswork to AI-driven discovery. We'll show you how to gain an objective view of market structure, identify high-probability setups faster, and align your trades with institutional-grade precision. It's time to stop drawing lines and start detecting alpha.
Key Takeaways
- Align your strategy with the 70% of market volume driven by algorithms to avoid the traps of subjective manual charting.
- Deploy an automated support and resistance level finder to map institutional liquidity zones with clinical precision and zero emotional bias.
- Learn to distinguish between static mathematical pivots and adaptive AI models that recalibrate based on 2026 volatility regimes.
- Build a systematic execution workflow that prioritizes high-probability market structures over information overload.
- Shift your focus from individual chart analysis to a discovery-first methodology that scans thousands of tickers for institutional upside.
The Evolution of Support and Resistance in the Algorithmic Era
In 2026, the concept of support and resistance has moved beyond simple horizontal lines on a screen. High-frequency trading (HFT) firms generate up to 73% of daily equity volume. These systems don't care about the lines you drew yesterday. They hunt liquidity. Relying on an automated support and resistance level finder is the only way to process this data at institutional speed. Traditional charting is too slow. It's too personal. It lacks the clinical precision required to survive a market driven by programmatic execution.
The Death of Subjective Charting
Manual charting is often just a mirror of a trader's hope. If you're long, you'll find a reason to draw a support line. This is confirmation bias in its purest form. Two traders looking at the same ticker often see three different levels because their eyes prioritize different data points. This subjectivity is a liability in a high-speed environment.
- Inconsistency: Your level identification changes based on your mood, bias, or fatigue.
- Latency: By the time you manually identify a level, the algorithmic sweep has already occurred.
- Scale: Human analysts cannot manually chart 6,000 stocks with any degree of accuracy.
An objective, rule-based approach removes the "art" and replaces it with evidence. It's about finding what is actually there, not what you want to see. Professionals require a repeatable process that yields the same results regardless of who is looking at the chart.
How Institutional Flow Redefines Levels
Institutional algorithms don't look for price peaks; they look for liquidity pools. These are areas where large orders can be filled without moving the price too far. Often, these pools sit just beyond retail-identified levels. This leads to "stop hunts" where price briefly breaks a level to trigger retail stops before reversing sharply. Static math and manual lines are easily exploited in these scenarios.
Integrating automated stock market analysis into your workflow allows you to see these clusters before they are tested. An automated support and resistance level finder doesn't just draw lines. It identifies the structural nodes where institutional volume is actually clustering. This shifts your perspective from guessing where price might stop to knowing where the big money is waiting. The goal is to move from being liquidity for someone else to trading alongside the firms that move the market.
How Automated Level Finders Decode Market Structure
An automated support and resistance level finder is essentially a logic-gate system for price action. It converts raw ticker data into a hierarchy of high-probability inflection points. While a retail trader might manually draw a line based on a single visible peak, an automated system scans thousands of data points across multiple timeframes simultaneously. It identifies where the highest concentration of historical price rejection exists. This creates a clean, objective view of the market. It replaces the "hunch" with a calculated probability.
Mathematical Foundations of Automated Discovery
The core of these systems relies on sophisticated quantitative models. Research into algorithmic pattern recognition in technical analysis shows that mathematical smoothing and kernel density estimation can isolate structures that the human eye often misses. Most professional tools use fractal geometry to define swing highs and lows. This process involves comparing a central candle to its neighbors to confirm a structural pivot. By applying standard deviation filters, the algorithm distinguishes between minor market noise and significant structural shifts. If price remains within a tight volatility band, the system remains silent. It only triggers when price interacts with a level that has statistically significant historical weight.
The Role of Volume Profile in Level Validation
Price levels are often meaningless if they lack corresponding volume data. A horizontal line at $150 only matters if thousands of shares changed hands at that price. Professional-grade automated support and resistance level finder tools integrate volume-at-price analysis to find High Volume Nodes (HVN). These nodes represent areas where institutional players have established heavy positions. When price returns to an HVN, it acts as a magnet or a springboard. Automating this search allows you to identify "true" support where money is actually committed, rather than just "perceived" support based on a visual peak.
There is a critical distinction between visual aids and actionable alerts. A visual aid merely paints a line on your chart. An actionable alert notifies you when price, volume, and volatility converge at a specific structural point. This moves you from passive observation to active execution. You no longer need to watch 20 charts for a breakout. The system watches them for you. For traders who want to bypass the complexity of manual configuration, TickerAI Full-Access automates this entire discovery loop, surfacing setups where structure and volume align perfectly.
Comparing Algorithm Types: Static Math vs. Adaptive AI
The core of any automated support and resistance level finder lies in its underlying logic. Most traders rely on static mathematical formulas. These models calculate levels based on fixed historical data points. While transparent, they lack the agility required for 2026 volatility. Adaptive AI models, by contrast, utilize machine learning to recalibrate in real-time. The choice between these two determines whether your chart is a historical record or a predictive tool. Static math tells you where price was; adaptive AI suggests where the next liquidity pocket is forming.
Legacy Systems: Pivots and Fibonacci
Static algorithms like Floor Pivots and Camarilla levels are the industry's traditional benchmarks. They use yesterday's high, low, and close to project today's inflection points. These levels often act as self-fulfilling prophecies. Many retail participants and basic algorithms place orders at these exact coordinates. This creates temporary friction in price movement. Fibonacci retracements operate on a similar principle of mathematical symmetry. These tools are often "enough" for basic trend-following strategies. However, they fail during regime shifts. When volatility expands, static levels are frequently bypassed without hesitation. They don't account for the institutional slicing of liquidity described in the SEC report on algorithmic trading.
The AI Edge: Dynamic Anomaly Detection
Adaptive AI represents the next stage in technical execution. These systems use clustering algorithms, such as K-Means or DBSCAN, to group price rejections by density rather than just price. This identifies "hidden" levels where multiple data streams converge. An AI-driven automated support and resistance level finder doesn't just look at price. It monitors volume-price divergence and order flow to validate a level's strength. It filters out the noise of minor swing highs to focus on structural anchors. This clinical approach is why professional traders are shifting toward quantitative investing models.
The true value of AI isn't just drawing the line. It's the context provided by the signal. You aren't just looking for a bounce. You're looking for institutional accumulation. Success in this environment requires interpreting AI stock signals as part of a broader discovery workflow. Observation leads to action. If the AI detects a high-density cluster at a specific price node, it signals a high-probability setup. Static math is a map of the past; AI is a scout for the immediate future.
Building a Systematic Workflow with Automated Levels
A professional workflow transforms an automated support and resistance level finder from a simple chart overlay into a repeatable profit engine. Discovery requires structure. Without a systematic approach, even the most precise levels become noise. Successful execution in 2026 relies on a modular process that filters out low-probability environments and focuses on institutional footprints. Follow this five-step framework to institutionalize your trading desk.
- Step 1: Define your universe. Focus your scanning on specific sectors, such as high-growth tech or liquid large-cap equities. Narrowing your scope allows the algorithm to provide deeper contextual data.
- Step 2: Configure for liquidity. Set your finder to prioritize "liquidity-rich" levels. These are areas where historical volume clusters and structural pivots converge.
- Step 3: Overlay catalyst data. Validate a structural level by checking for fundamental drivers. A support level is significantly more reliable when it aligns with positive earnings or a sector-wide macro shift.
- Step 4: Establish rule-based criteria. Define your entry and exit points before the trade. For example, enter on a successful retest of a resistance-turned-support level with a stop-loss placed just below the nearest high-volume node.
- Step 5: Audit and refine. Log every trade. Use performance data to adjust your algorithm's lookback periods or sensitivity settings to match current market regimes.
Filtering Noise for Action-Oriented Discovery
Professional traders avoid "indicator soup." Cluttering your screen with conflicting signals leads to analysis paralysis. Your automated support and resistance level finder should be your primary structural filter. Prioritize levels that align with higher-timeframe trends. If the daily chart is bullish, focus exclusively on support bounces. Use automated alerts to replace constant screen monitoring. Let the system notify you when price enters a high-probability zone; this frees your cognitive resources for decision-making rather than data watching.
Removing Emotion from the Entry Process
Trusting the system is often more difficult than building it. Human intervention is the primary cause of slippage and missed opportunities. There is a distinct psychological benefit to using AI to remove emotion from your daily routine. By relying on objective, automated signals, you transition from "predicting" what the market might do to "reacting" to what the data shows. This shift creates a clinical trading environment where execution is a binary response to a validated signal. To start building your own systematic workflow with professional-grade alerts, explore the discovery tools available through TickerAI Pro.
Beyond Levels: TickerAI’s Discovery-First Methodology
Identifying a price node on an arbitrary chart is a low-value task in 2026. The real edge lies in finding the specific assets where institutional volume is actively clustering. An automated support and resistance level finder is only as effective as the universe of stocks it monitors. TickerAI inverts the traditional workflow. Instead of manually applying indicators to one chart at a time, the TickerAI engine scans over 6,000 U.S. equities every few minutes. It scores bullish setups on a quantitative scale from 60 to 95. This discovery-first model ensures you only focus on charts where structural edge already exists. By the time a retail trader draws a line, TickerAI has already flagged the opportunity.
Discovery vs. Analysis: The TickerAI Advantage
Analysis is often a post-mortem of price action. Discovery is a proactive search for future opportunity. While competitors provide tools to build custom scripts, they leave the search process to the user. TickerAI Full-Access automates the entire loop. It detects momentum breakouts and institutional footprints in real-time. A professional swing trade setup finder is more valuable than a standalone indicator because it filters for quality before you ever open a chart. You move from being a passive observer to a proactive hunter. Alerts are delivered with clinical precision, providing entry targets and stop invalidation points immediately. The system functions as a tireless assistant, scanning for high-potential movements while you focus on capital allocation.
Selecting the Right Tier for Your Trading Style
Systematic discovery requires tools matched to your capital and goals. TickerAI offers tiered access to suit your professional requirements. TickerAI Pro provides high-frequency swing trade setups and smart watchlist alerts to remove market noise. For the complete intelligence suite, TickerAI Full-Access integrates short-term alerts with long-term investment ideas and dark-pool tracking. These professional-grade systematic discovery tools replace the need for a basic automated support and resistance level finder by providing the broader market context. Execution requires clarity. Start your systematic discovery journey today. Align your capital with the assets that show the highest algorithmic probability of success. The market moves fast; your discovery engine should move faster.
Institutional Execution in the Algorithmic Age
The 2026 market doesn't wait for manual analysis. Success requires moving from the subjectivity of hand-drawn lines to the clinical precision of an automated support and resistance level finder. We've explored how adaptive AI models outperform static math by identifying institutional liquidity zones in real-time. You now have the framework to build a systematic workflow that removes emotion and prioritizes high-probability setups. Data dictates the move; your tools must provide the clarity.
The true edge isn't just seeing the levels. It's discovering the tickers where those levels actually matter. TickerAI bridges this gap by scanning thousands of assets to deliver professional-grade intelligence directly to your desk. Through AI-driven real-time market alerts and professional swing trade setups, you can focus on execution rather than data entry. It's time to stop reacting to the past and start anticipating the next structural move. Precision is a choice.
Stop drawing lines and start discovering opportunities with TickerAI Full-Access. Leverage smart watchlists for systematic discovery and secure your place as a serious participant in the high-speed environment. Your professional evolution begins with better data.
Frequently Asked Questions
What is an automated support and resistance level finder?
An automated support and resistance level finder is a logic-driven software system that scans historical and real-time price data to identify key structural inflection points. It replaces manual charting by applying mathematical rules to define swing highs, swing lows, and liquidity zones. These tools eliminate the subjectivity of human analysis, providing a clean, objective view of market structure based on hard data rather than visual estimation.
How accurate are automated support and resistance indicators?
Accuracy varies based on the underlying algorithm. Static indicators like Fibonacci or standard pivots provide fixed coordinates that many retail traders follow, making them self-fulfilling at times. However, in an environment where algorithmic systems execute 70% of U.S. equity volume, adaptive AI models are significantly more precise. These models validate levels using volume-at-price and volatility metrics, filtering out the noise that often traps manual chartists.
Can AI really predict where price will bounce or break?
AI doesn't predict the future; it calculates probabilities based on historical institutional footprints. By identifying high-density volume clusters and structural anchors, AI-driven tools isolate zones where price is statistically likely to react. It identifies discovery opportunities where price, volume, and momentum align. This allows traders to react to validated signals rather than guessing based on static lines that institutional HFT systems frequently exploit.
Which is better: static pivot points or AI-driven levels?
AI-driven levels are superior for active traders in the 2026 market. Static pivot points rely on fixed formulas that cannot account for sudden regime shifts or volatility expansions. Adaptive AI models utilize clustering algorithms to group price rejections by density, offering a dynamic view of the market. While static math is useful for basic trend-following, AI provides the institutional-grade precision required to identify hidden liquidity pools.
Do automated level finders work on all timeframes?
These tools function across all timeframes, from one-minute scalping charts to monthly investment views. However, the reliability of a level increases with the timeframe. Institutional players operate on higher timeframes, creating more significant structural anchors on daily and weekly charts. A professional automated support and resistance level finder should be used to identify confluence across multiple timeframes to increase the probability of a successful trade setup.
How do I filter out the noise from automated charting tools?
Filtering noise requires a systematic approach. Focus on levels that align with the primary trend and prioritize high-volume nodes over minor price peaks. You can also use volatility filters, such as Average True Range (ATR) buffers, to avoid entering on false breakouts. Professional discovery tools often incorporate these filters automatically, notifying you only when price interacts with a statistically significant structural zone that matches your predefined criteria.
Is an automated finder enough to build a profitable trading strategy?
A level finder is a critical component, but it's not a standalone strategy. Profitability requires a comprehensive workflow that includes risk management, catalyst validation, and systematic opportunity discovery. You must combine structural analysis with a clear understanding of market regime and sector momentum. Relying solely on a single indicator without a broader discovery loop often leads to overtrading and missed institutional-grade setups in fast-moving environments.
What is the difference between an indicator and a discovery platform like TickerAI?
An indicator is a passive tool that draws lines on a specific chart you are already watching. A discovery platform like TickerAI is a proactive engine that scans the entire market to find setups for you. TickerAI Full-Access and Pro tiers provide smart watchlists and real-time alerts across 6,000+ stocks. It shifts your focus from analyzing one chart to discovering the best opportunities currently available in the market.


